shape
carat
color
clarity

Blog Retail Diamond Prices For April 2020

psadmin

Brilliant_Rock
Staff member
Premium
Joined
Apr 19, 2008
Messages
1,493
round-diamond-prices-1st-quarter-2020.png


psadmin submitted a new blog post

Continue reading the Original Blog Post.
 
Last edited:
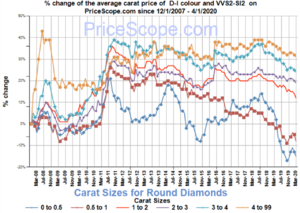
It seems everyone has been interested in the diamond prices so I finally got my self to put something together. The diamond price charts and info is based on round diamonds and the retail value as they are in our database.

Let me know what you think about where the prices might go.

All feedback is welcome. Do you wish for me to do this on a monthly basis?
 
Thanks - it is an interesting chart. Diamond prices seem to have dropped recently but I am sure sales have stalled as well. Stands to reason that the prices will drop with lower sales but I am guessing that inventory won’t grow much either. PSers in other threads had indicated that they wouldn’t be spending on luxury items for fear of the unknown. I understand that reasoning to a point but it is also the reason that the economy won’t take off quickly once this is somewhat behind us. This will probably be the case for a lot of other retail areas as well. It will pick back up in time of course but it makes you wonder how many businesses - and not just the diamond businesses - won’t come back. So sad.
 
On a monthly basis would be nice. Especially since we aren't sure where the economy is heading for the duration of the year. Thank you for this.
 
Great work Andrey - Supply of rough and polishing factories have all but stopped, so supply may even be less than demand, and Rapaport was actually showing rises in +3ct before his perfect storm hit as discussed in another lively thread here.
 
If the US government kept on printing $1 trillion per month a 1ct H VS2 stone will retail for $50K soon.
 
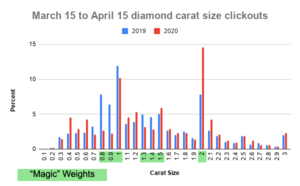
With all the talk about diamond pricing and what are people thinking. I decided to compare what carat size diamonds consumers are looking at in the last 30 days.

I was surprised to notice that the carat sizes that we consider "Magic" Weights have shifted to higher carats size. See the chart below.

It might be due to price or wishful thinking. Either way, I thought it was interesting.

Since I have been collecting the data 1-carat size was the clear primary magic weight by a margin. This is the first time that 2-carat has taken the lead.


March 15 to April 15 diamond carat size clickouts.png

I don't think we can truly make any conclusions, but something to think about.
 
Thanks Andrey.
Interesting.

Do you also have access to data on FCDs?
 
This is very interesting thank you.
 
Thanks Andrey.
Interesting.

Do you also have access to data on FCDs?


I do have some data, but it isn't as easy together.

Are you looking for FCD prices or click outs?
 
Thanks ... prices.
By color and Argyle, if you got it.

Thanks for all the trouble, Andre.
 
Last edited:
Great data Andrey!
 
Thanks ... prices.
By color and Argyle, if you got it.

Thanks for all the trouble, Andre.

Not sure I can do that, but I will see what can be gathered. I am not sure FCDs are as simple.
 
With all the talk about diamond pricing and what are people thinking. I decided to compare what carat size diamonds consumers are looking at in the last 30 days.

I was surprised to notice that the carat sizes that we consider "Magic" Weights have shifted to higher carats size. See the chart below.

It might be due to price or wishful thinking. Either way, I thought it was interesting.

Since I have been collecting the data 1-carat size was the clear primary magic weight by a margin. This is the first time that 2-carat has taken the lead.


March 15 to April 15 diamond carat size clickouts.png

I don't think we can truly make any conclusions, but something to think about.

Indeed this is interesting. And counter intuitive. But we will need to wait until trading resumes to make any real sense of the market.

Do you think this data was impacted by removal of listings as a result of the Rapnet revolt?
 
  • Like
Reactions: AV_
If you are talking about carat size click out data graphs, it has nothing to do with Rap as this is what consumers are clicking.

As for the round diamond prices, there are too many variables at this time to truly make a fair opinion.
 
Is it possible people are going down in color and upping size?
 
If you are talking about carat size click out data graphs, it has nothing to do with Rap as this is what consumers are clicking.
Yes, but if they are searching a smaller dataset because of listings being removed, and that dataset perhaps contains fewer of the sub-prime sizes, it could increase the percentage of clicks on the magic sizes.

I have no way of knowing the makeup of your dataset, but since there have been some significant changes to Rapnet recently I'm wondering if that has any bearing.

After the Great Recession the biggest trend we saw while the market got back to normal was a general trading down in size. I would expect the same to happen this time around. It might be just too soon to tell.
 
All the charts are based on a similar dataset.
 
@psadmin Is the diamond price chart based on 2007 pricing?

In other words, is the pricing shown the % increase or decrease since 2007?
 
@psadmin Is the diamond price chart based on 2007 pricing?

In other words, is the pricing shown the % increase or decrease since 2007?

Yes, the overall round diamond prices are based on the original base point of pricing since 2007 that is when we started to track them.
 
One must keep in mind that overall prices data might be altered simply by more lower clarity and color diamonds in the total listings of stones. It looks as if the data is based on all diamonds listed, and if this is the case, is there a way to break down previous and current data into categories such as G-Si1 or I-VS2, etc?. Maybe dealers are listing a bit lower quality stones skewing such a graph. Do you know?
 
@psadmin Is the diamond price chart based on 2007 pricing?

In other words, is the pricing shown the % increase or decrease since 2007?
From the home page:
1587341823104.png
 
Thank you @psadmin and @Garry H (Cut Nut), now that I have the background, the data for the last three months is more in context and much more understandable.
 
Thank you @psadmin and @Garry H (Cut Nut), now that I have the background, the data for the last three months is more in context and much more understandable.

We update that graph every month and have it also available for other shapes here:

 
The updated May 2020 chart indicates the prices fell more:

Anyone has thought on where the prices will go...
 
We can see the shortages in smaller sizes already.
Indian factories are closed or 10 to 30% operations
 
GET 3 FREE HCA RESULTS JOIN THE FORUM. ASK FOR HELP
Top