shape
carat
color
clarity

AGS new cut grade system early 2005

Status
Not open for further replies. Please create a new topic or request for this thread to be opened.

valeria101

Super_Ideal_Rock
Premium
Joined
Aug 29, 2003
Messages
15,808
Garry, does the name of your diamond pic (Striker mixed72dpi.jpg) relates to "Striker resources" by any chance?
 

Garry H (Cut Nut)

Super_Ideal_Rock
Trade
Joined
Aug 15, 2000
Messages
18,463
Very Good Detective Ana
1.gif


The chairman and many staff are old friends from Ashton Mining who found Argyle and Merlin.

They were taken over by Rio in a bidding war with De Beers, who probably wanted Ashton so they could find out how to be more like RioTinto (who wiped the floor with De Beers over the stoopid price war when Argyle dropped the DTC supply contract).

an Israeli firm cut them to my specs
1.gif
 

valeria101

Super_Ideal_Rock
Premium
Joined
Aug 29, 2003
Messages
15,808
----------------
On 9/17/2004 10:10:40 PM Garry H (Cut Nut) wrote:


...An Israeli firm cut them to my specs ----------------


Just happened to remember the line up from their annual report. Making a mining company's poster kids sounds good to me
2.gif
 

Garry H (Cut Nut)

Super_Ideal_Rock
Trade
Joined
Aug 15, 2000
Messages
18,463
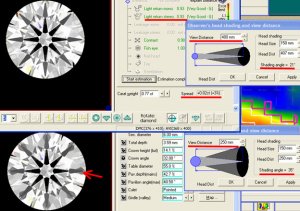
I made a comment recently that AGS view diamonds from as close up as 8 inches (20cm).
I have been corrected (correctly) from on high - the figure is 10 inches (25cm).
AGS researchers believe that any diamond that looks good with the observers head (and body) obstructing as much as 35 degrees of the available 180 degrees of light will be a good looking diamond in any environment.

When I modelled for HCA I used 16 inches (40cm). That means I approve of shallower diamonds, like the one in this diamcalc which scores 1 on HCA (T55 C32 P40.5).

The image shows the difference in appearance with each of the observer head positions.

Note that I have done a DiamCalc Cut quality on it and the light return is 7% lower at .93. I never had a DiamCalc cut quality tool when I developed HCA. Had I had this data perhaps I would have been a bit harder on shallow stones?

Note also that this shallow stone has a 3% better spread shown on the DaimCalc than a Tolkowsky stone with a thin girdle. HCA gives a penalty for poor spread. In fact this penalty actually works more like a bonus for shallow stones spread. So naturally a shallow stone gets a help and a better score.

For all these reasons it would be reasonable to expect that AGS's new system will not like my shallow stones.

AGS 250vsHCA400small.jpg
 

Garry H (Cut Nut)

Super_Ideal_Rock
Trade
Joined
Aug 15, 2000
Messages
18,463
Dave Tiddly does mean slightly drunk
1.gif

Actually it was French Champagne - had something to celebrate that Paul knows about
appl.gif


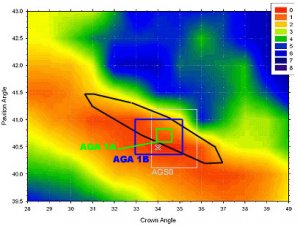
Dave here is AGA 1A and 1B.

Your system will guarantee a great result but at great cost. Remember someone always pays
6.gif


Paul has been doing some calculations which he probably should not post here because he would be needlessly teaching lurking cutters how to play the new game. Suffice to say a few percent of weight gains could add up to 10 -20% value gain. In a world of scarce resources - that is like finding a new $1 Billion dollar a year mine!

AGAAGSHCA.jpg
 

oldminer

Ideal_Rock
Trade
Joined
Sep 3, 2000
Messages
6,695
Garry:

THANK YOU....

I can certainly visualize this better than imagine it...

It is much appreciated. I can see the 1A is a very narrow field. It is exactly what I intended. Maybe I will need to make a 1C field to equal the AGS 0 range. Maybe 1C should be the sausage shaped outline of the best light return...

Anyway, I appreciate it. Back to celebrating...

Dave
 

adamasgem

Brilliant_Rock
Joined
May 23, 2003
Messages
1,338
----------------
On 9/16/2004 10:37:37 PM valeria101 wrote:

Is the AGS going to state the new rule with a range of crown and pavilion angles as before? Or some crown&pav relation?

I am not sure if the drawing shows the problem well: but... using a range for each of the two angles (the old way) one can obtain a square on the chart.

If the new ideal range is as Garry drawn it, than it is not feasible to define it in the old way - otherwise the resulting rectangular area will go way outside the desirable range (shown left) or… you need allot of little squares (right) each for a certain narrow range of crown and pavilion angles (right). The first version leaves undesirable areas inside the advised range, and the second version yields a hard to justify grade with debatable no-go areas. IMO.
----------------

Nice pictures Gary, but are they comparing apples to apples..

1) The MSU contour maps were based on a lighting model which has never been publically and explicitly defined, such that it can be reproduced. If I am wrong please correct me and supply the information, I'd like to run the data through the SAS2000 3D raytrace software, as I have done for the GIA study.

2) To my knowledge, the lighting model that AGS is using, or will use, has yet to be publically defined, and I am not privy to it..

There is such a radical difference in relative light performance of a diamond, dependent on the lighting model, that you can "almost" pick an environment to prove what you want to prove, for whatever cut you want to prove it for. My studies have shown a factor of two difference in light return dependent on whether the light is from overhead or from the side.

The published GIA uniform hemispherical model does not reflect any realistic or relaizable physical human viewing environment

While academically interesting, the un-attenuated theoretical light return models, do not reflect the non linear effects of internal absorption of light within the diamond, so while the ray that contributes to "the metric" in the un-attenuated model, may not EXIST to contribute to a metric in the real diamond.

Because of the non linearity of internal absorption, a performance contour map (lets say for crown angle versus pavilion depth) drawn for one carat size stones will not be the same as one for 5 carat stones of the same homogeneous nature..

The color, size, and cut of a diamond all effect light performance, and NO ONE has yet, to my knowldege, presented the technical work that backs up the un-attenuated model approximations that are being fostered. Are they better than what we have today, empirical judgements, perhaps, but I question how much better..

NONE of these "models" address how the diamond looks, although I am told that AGS will address a contrast issue. I have personally looked at the uniformity of light return across the face of the diamond, for the round brilliant, and am looking at defining and quantifying a metric for that aspect, which has not been addressed to date.

NONE of the "models" address the statistical uncertainty in the metric results published, uncertainties about the mean value used for the contour map. I've looked at this and am at a quandry as to how to approach it, as we are not dealing with gaussian distributed distribution functions.

Unfortunately, these studies are computer time intensive, and I applaud those who have the resources to attempt them, and generate the "contour map" data, but I fear that these published data may present and have generated possible erroneous conclusions.

As an engineer with more than minimal credentials to question, correct and duplicate, what has been published to date, I only caution the consumer to be wary of those who put too much credance what has been generated..

Food for thought..

Marty Haske
 

Garry H (Cut Nut)

Super_Ideal_Rock
Trade
Joined
Aug 15, 2000
Messages
18,463
Great points Marty.

I agree with pretty well all of them.

(That is probably a first - GH and MH agreeing publicly
appl.gif
)

Sergey's OctoNus solution will address all your issues (especialy size differences), and the most important one that you left out.

Fire is dependant on lighting type. and so far everyone has modeled fire the wrong way. They have used rays of parallel light. Direct light from the sun is the only valid case.

Light from globes, strips, windows and walls is very different and has a completly different effect - and sergey has found a new way to model it
1.gif
And account for pupil size variations in different intensity / brightness.

There is aother thread you should read Marty
 

adamasgem

Brilliant_Rock
Joined
May 23, 2003
Messages
1,338
----------------
On 9/19/2004 3:49:19 PM Garry H (Cut Nut) wrote:

Great points Marty.


I agree with pretty well all of them.


(That is probably a first - GH and MH agreeing publicly
appl.gif
)


Sergey's OctoNus solution will address all your issues (especialy size differences), and the most important one that you left out.


Fire is dependant on lighting type. and so far everyone has modeled fire the wrong way. They have used rays of parallel light. Direct light from the sun is the only valid case.


Light from globes, strips, windows and walls is very different and has a completly different effect - and sergey has found a new way to model it
1.gif
And account for pupil size variations in different intensity / brightness.


There is aother thread you should read Marty ----------------
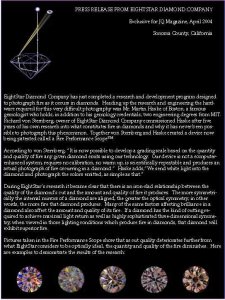

Well Gary, As to direct sunlight, I don't think you are going to see much fire... And I've had some experiance with being able to photograph what is happening.

I agree, the models used to quantify fire, using parallel rays akin to a gemprint system with white light, will give you a measure, but probably aliases any theoretical results. I'm starting to look at the theoretical model in the SAS2000 software of what I consider to be a non aliasing, yet representative physical environment which enables visualization and photography of fire, but I'll keep that model information private for now.

Sergey is doing interesting work, and I follow it.

8starjqred.jpg
 

Rank Amateur

Brilliant_Rock
Joined
Feb 26, 2003
Messages
1,555
What is the nature of the light heading into the stone which is measured by this instrument? The diagram seems to indicate parallel rays with the viewer at an angle, yet the photos would be from a top-down viewing position. Or are the photos some sort of composite?

Seems like the original "FireScope" was mis-named.
 

Garry H (Cut Nut)

Super_Ideal_Rock
Trade
Joined
Aug 15, 2000
Messages
18,463
Does your method outlined in that article 'quantify' fire Marty?
Would you call a system like the Firescop(r) or ideal-Scope a grading scale Marty?

We believe the collomation of light is a no-no. Hope you are using beams or cones and not rays
1.gif
 

adamasgem

Brilliant_Rock
Joined
May 23, 2003
Messages
1,338
----------------
On 9/19/2004 11:26:47 PM Richard Sherwood wrote:

Hey Marty, is that Fire Performance Scope on the market?

----------------


We can build one for you, under licence agreement.. Give me a call and I'll tell you about it
 

adamasgem

Brilliant_Rock
Joined
May 23, 2003
Messages
1,338
----------------
On 9/19/2004 11:36:10 PM Rank Amateur wrote:

What is the nature of the light heading into the stone which is measured by this instrument? The diagram seems to indicate parallel rays with the viewer at an angle, yet the photos would be from a top-down viewing position. Or are the photos some sort of composite?


Seems like the original 'FireScope' was mis-named. ----------------


White light input.. The "diagram" I guess was just used to illustrate how dispersion occurs,

Photos are actual shots, no composite playing around, saturation increased uniformly for printing.
 

adamasgem

Brilliant_Rock
Joined
May 23, 2003
Messages
1,338
----------------
On 9/19/2004 11:36:10 PM Rank Amateur wrote:


Seems like the original 'FireScope' was mis-named. ----------------


I would agree there...
 

strmrdr

Super_Ideal_Rock
Joined
Nov 1, 2003
Messages
23,295
one problem I see with all these studies is no one seems to answer some of these questions.

1> at what point does the difference become noticeable to the average person?
2> what is the min. acceptable amount for the average person?
3> what is the max. thats achiviable?
4> what unit are they messured in when someone says this diamond has more fire? OK kewl but how much more? (made up answer) ummmmm 1000 MicroFire2 more.
5> what is the complete definition of fire in a diamond that eliminates the other return and just defines the fire?
6> how do you seperate the other types of light return to just measure fire? and when you do what do you measure it in?
 

adamasgem

Brilliant_Rock
Joined
May 23, 2003
Messages
1,338
----------------
On 9/20/2004 12:32:39 AM Garry H (Cut Nut) wrote:

Does your method outlined in that article 'quantify' fire Marty?

Would you call a system like the Firescop(r) or ideal-Scope a grading scale Marty?


We believe the collomation of light is a no-no. Hope you are using beams or cones and not rays
1.gif
----------------


"Does your method outlined in that article 'quantify' fire Marty?"

The photos "quantify" fire performance. We are looking at a qualitative scaling scheme
for the photos. I haven't spent much time on a "quantitative" processing of the photos,
although I suspect that one might be able to generate a "number" for a fire photo.

The qualitative breakdown is dramatic as to good versus average vs bad fire performance,
and one can rather quickly recognize a good stone..

"Would you call a system like the Firescop(r) or ideal-Scope a grading scale Marty?"

I think that Firescope images can be used in a grading system, I don't think that the consumer
"ideal-scope" I have seen can because of the non uniformity in its use, and it is telling you different things than the "Firescope", as I have stated before..


"We believe the collomation of light is a no-no. Hope you are using beams or cones and not rays"

Gary, Most physical systems that I know of don't produce truly "collimated" light rays, and the ones that I have used as star field simulaors were very expensive. In fact, even solar rays are not perfectly collimated due to athmospherics. The closest you will get to a truly "collimated" source of light are exo-athmospheric rays from stars.

To "collimate" to +/-1 arc-minute you need a 0.0003 inch hole drilled in a 1 inch thich piece of material, 0.0006 in a two inch thick piece.. One (1) degree "collimation" is somewhat more realistic, requiring a 0.017" hole in a 1 inch thick piece.. and you don't get much light from it.. I hope tah the the others included in the "We" of your statement understand the problem a little better than you do.. so try to stick to questions and answers where you have a little more understanding of the problem questions or statements that you pose..

If you are playing theoretical games regarding using collimation of light rays, then I probably agree with your statement, as collimated sources really don't exist in nature here on earth, but quasi collimated sources in use, or modeled by, let us say, GIA, are fine for a thoretical study, but are inappropriate for use as a metric in grading diamonds, in my opinion.
 

Serg

Ideal_Rock
Trade
Joined
Mar 21, 2002
Messages
2,628
----------------
On 9/20/2004 9:37:37 AM adamasgem wrote:

----------------
On 9/20/2004 12:32:39 AM Garry H (Cut Nut) wrote:


If you are playing theoretical games regarding using collimation of light rays, then I probably agree with your statement, as collimated sources really don't exist in nature here on earth, but quasi collimated sources in use, or modeled by, let us say, GIA, are fine for a thoretical study, but are inappropriate for use as a metric in grading diamonds, in my opinion.


----------------


Hi Marty,

Did you read below text?
Do you agree with statements or not?

http://www.cutstudy.com/cut/english/grading1/6.htm
Therefore:

In the GIA model, the probability of observing a green ray is the same as that for any other color. In real diamonds, green rays are observed much more rarely than blue and yellow rays;

GIA metric for dispersed color light return DCLR is almost independent of dispersion. For example, if we consider a material, the dispersion of which is two times weaker than that of diamond, the DCLR will be almost the same as that for diamond! Moreover, if we suppose that there is absolutely no dispersion in the material of the considered stone, the DCLR not only fails to become zero, but even remains close to the value calculated by GIA (just dispersion, not refractive index). Let us consider green color, which is located in the center of visual color range and red and blue colors lie on opposite sides of the green color, at equal distances on visual spectrum. The deviation of blue and red spots from green spot on registration sphere depends on the dispersion of the material. In any case, these deviations are small enough and almost equal one another. Note

When calculating DCLR, the GIA team performs summation. As a result, the red and blue rays compensate each other, and their overall mean DCLR is almost equal to that of the central green ray. Then let us change (decrease) dispersion value of material fixing refractive index for green color. The location of all such green spots on the sphere used by the GIA group for registration will not change, and blue and red spots will be closer to green. When calculating DCLR blue and red rays again compensate each other and we will get the same DCLR value as before!

This statement can be illustrated by the following formula:


Here for each arbitrary light beam:
a - direction of green ray
2d - angle between red and violet rays.

It is clear from the common sense that if dispersion equal zero fire will not appear. Thus, the following questions arise: What is the merit of the GIA's approach from the viewpoint of modeling the fire and what does the DCLR metric actually describe?
 

strmrdr

Super_Ideal_Rock
Joined
Nov 1, 2003
Messages
23,295
Has anyone addressed the function of facet junctions and near facet junctions play in creating fire?
 

adamasgem

Brilliant_Rock
Joined
May 23, 2003
Messages
1,338
----------------
On 9/21/2004 2:15:43 AM Serg wrote:

----------------
On 9/20/2004 9:37:37 AM adamasgem wrote:

----------------
On 9/20/2004 12:32:39 AM Garry H (Cut Nut) wrote:


If you are playing theoretical games regarding using collimation of light rays, then I probably agree with your statement, as collimated sources really don't exist in nature here on earth, but quasi collimated sources in use, or modeled by, let us say, GIA, are fine for a thoretical study, but are inappropriate for use as a metric in grading diamonds, in my opinion.


----------------


Hi Marty,

Did you read below text?
Do you agree with statements or not?

http://www.cutstudy.com/cut/english/grading1/6.htm
Therefore:

In the GIA model, the probability of observing a green ray is the same as that for any other color.

Sergey, I think that might have to do with the probability of incident rays

In real diamonds, green rays are observed much more rarely than blue and yellow rays;

Haven't proved that one to myself

GIA metric for dispersed color light return DCLR is almost independent of dispersion.

Haven't modeled it yet so I can't say

For example, if we consider a material, the dispersion of which is two times weaker than that of diamond, the DCLR will be almost the same as that for diamond!
Moreover, if we suppose that there is absolutely no dispersion in the material of the considered stone, the DCLR not only fails to become zero, but even remains close to the value calculated by GIA (just dispersion, not refractive index).

Interseting, if that is the case, then they have a serious theoretical problem with their metric

Let us consider green color, which is located in the center of visual color range and red and blue colors lie on opposite sides of the green color, at equal distances on visual spectrum. The deviation of blue and red spots from green spot on registration sphere depends on the dispersion of the material. In any case, these deviations are small enough and almost equal one another. Note

When calculating DCLR, the GIA team performs summation. As a result, the red and blue rays compensate each other, and their overall mean DCLR is almost equal to that of the central green ray. Then let us change (decrease) dispersion value of material fixing refractive index for green color. The location of all such green spots on the sphere used by the GIA group for registration will not change, and blue and red spots will be closer to green. When calculating DCLR blue and red rays again compensate each other and we will get the same DCLR value as before!

Seems they shouldn't be averaging the rays but averaging the differences between the red and blue rays or something like that

It is clear from the common sense that if dispersion equal zero fire will not appear.

Seems like a reasonable assumption
1.gif


Thus, the following questions arise: What is the merit of the GIA's approach from the viewpoint of modeling the fire and what does the DCLR metric actually describe?

Can't answer that question Sergey, I just don't know (yet), haven't studied it
1.gif


----------------
 

Serg

Ideal_Rock
Trade
Joined
Mar 21, 2002
Messages
2,628
Thanks for answer, Marty
 

Serg

Ideal_Rock
Trade
Joined
Mar 21, 2002
Messages
2,628
----------------
On 9/21/2004 12:01:13 PM adamasgem wrote:

----------------
On 9/21/2004 2:15:43 AM Serg wrote:

----------------
On 9/20/2004 9:37:37 AM adamasgem wrote:

----------------
On 9/20/2004 12:32:39 AM Garry H (Cut Nut) wrote:


----------------


Seems they shouldn't be averaging the rays but averaging the differences between the red and blue rays or something like that


----------------

----------------


GIA use Area*Smoothed Intensity*Weighting Factor

see http://www.gia.edu/pdfs/Fall_2001_Cut.pdf
p.10

If Smoothed Intensity is close to real Intensity( Intensity of real spot in real world) , Area*Smoothed Intensity should be like constant

If theoretical Intensity of "Streake" do not depends from angle of dispersion( depends from Frenel law only), the Area*Smoothed Intensity is like Area.(or angle of Dispersion*) It is much better, but It has not good correlation with Fire for real Purple(or Source Light)


addendum:

* For case The "GIA Area " is Total Area of spot from red to blue rays.

For case the "GIA Area " is Area of spot 10 nm only, Area*Frenel Intensity=constant ( and DCLR does not depend from dispersion )
The main question : What is GIA Area and GIA Smoothed Intensity?
In DCLR the Area is integrable by color. It may be to mean GIA Area is not Total Area of spot from red to blue rays
 

adamasgem

Brilliant_Rock
Joined
May 23, 2003
Messages
1,338
----------------

GIA use Area*Smoothed Intensity*Weighting Factor

see http://www.gia.edu/pdfs/Fall_2001_Cut.pdf
p.10

If Smoothed Intensity is close to real Intensity( Intensity of real spot in real world) , Area*Smoothed Intensity should be like constant

If theoretical Intensity of 'Streake' do not depends from angle of dispersion( depends from Frenel law only), the Area*Smoothed Intensity is like Area.(or angle of Dispersion*) It is much better, but It has not good correlation with Fire for real Purple(or Source Light)


addendum:

* For case The 'GIA Area ' is Total Area of spot from red to blue rays.

For case the 'GIA Area ' is Area of spot 10 nm only, Area*Frenel Intensity=constant ( and DCLR does not depend from dispersion )
The main question : What is GIA Area and GIA Smoothed Intensity?

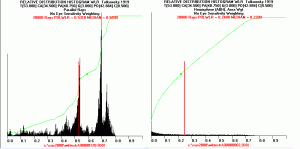
Sergey.. I looked at what GIA did, and I couldn't make heads or tails of it so I've been concentrating my efforts at modeling the environment which allows me to take the Fire pictures. What I see in a well cut stone with high optical symmetry (like an EightStar) is that facets light up in pure spectral hues, tha whole facet inytersetingly, where as in off cut stones the facets are pastels or earth tones, sort of a color mixing, or they are just black.

I have looked at the WLR distributions for parallel ray inputs and rather than a quasi uniform distribution (for hemispherical lighting) the WLRs for the GIA Fire model (parallel rays) group into clusters of intensity, as a function of the cutting..
See my comparison.. These clusters probably relate to the dispersion patterns GIA sees, (sort of a colored gemprint)

As I say, I'm off on a different track, trying to mathematically explain what I can photograph..


In DCLR the Area is integrable by color. It may be to mean GIA Area is not Total Area of spot from red to blue rays


----------------
tolkparallel.gif
 

Serg

Ideal_Rock
Trade
Joined
Mar 21, 2002
Messages
2,628
----------------
On 9/22/2004 1:01:06 AM adamasgem wrote:

----------------


I have looked at the WLR distributions for parallel ray inputs and rather than a quasi uniform distribution (for hemispherical lighting) the WLRs for the GIA Fire model (parallel rays) group into clusters of intensity, as a function of the cutting..
See my comparison.. These clusters probably relate to the dispersion patterns GIA sees, (sort of a colored gemprint)


----------------

Marty,

I can not understand How WLR is connecting with GIA Fire.
What output are you calculating?

Of course Fire for Hemisphere light should be close for any cut, because there is few Fire for this type of light
 

adamasgem

Brilliant_Rock
Joined
May 23, 2003
Messages
1,338
----------------
On 9/22/2004 3:36:08 AM Serg wrote:

----------------


Marty,


I can not understand How WLR is connecting with GIA Fire.

What output are you calculating?


Of course Fire for Hemisphere light should be close for any cut, because there is few Fire for this type of light ----------------


Segey.. What I have plotted is the probability distribution functions for WLR for the two lighting modes, hemispherical (used in the brilliance study) and parallel (used in their Fire article). The red line is the mean value of WLR, which is the number used in yors and GIA contour maps, and the green curve is the cummulative distribution function for WLR. The graphs shown are for the Tolkowsky cut model.
The spikiness of the parrallel model results relate or probably corrrelate to the intensity of the chromatic flare points GIA see (although not directly, because of the cosine square weighting).

Anyways the graphs suggest two things..

1) The distribution function of WLR for the Hemispherical model suggest that we don't have much confidence in the "average" WLR used, i.e. the uncertainty about the mean value of WLR often quoted as a measure of the cuts quality. The quasi uniform distribution functions for WLR create a quandry in that even though you can draw a quasi smooth WLR contour map for a range of, lets say crown and pavilion angles, there isn't a statistically significant difference between any two values, but thats just based on the numerics, mean and uncertainty of the mean. The distribution functions of course, are not characteristic of a classic gaussian normal distribution function nor are they a uniform distribution.

2) When we confine the rays to to parallel inputs, we see the spikiness in the distribution functions, and the spikiness varys quite a bit depending on the cut. There is definately a correlation to the "patterns" of chromatic flares that GIA has shown, although I'm not sure of the mathematics relating DCLR and WLR metrics, although DCLR is a function of intensity as I read it.

I'll go back and see if I saved the radial distribution functions for WLR, where I generated WLR versus radial position from the center of the stone..
 

Serg

Ideal_Rock
Trade
Joined
Mar 21, 2002
Messages
2,628
Marty,

The axis of absciss is latitude or is not?

What is 0 and 1 on axis of absciss?
 

adamasgem

Brilliant_Rock
Joined
May 23, 2003
Messages
1,338
----------------
On 9/22/2004 10:39:25 AM Serg wrote:

Marty,


The axis of absciss is latitude or is not?


What is 0 and 1 on axis of absciss?----------------
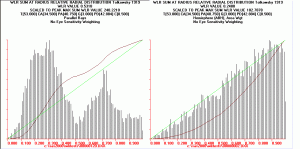


What I have shown previously are histograms of WLR intensity. The Y axis labeled 0 to 1 is normalized to peak probability, the cumulative distribution function in green goes from zero (0) (or some non level which indications proportion of input rays having a zero value of WLR) to one(1) , and the X axis is magnitude of WLR..

What I show in this post is the normalized (to peak probability) distribution of WLR across the radius of the stone, which would correlate to the density of the chromatic flares, as shown in GIA's Fall 2001 fire article Figure 7 on page 182, if you collapsed Figure 7 to a line and l;ooked at the sum intensity.

I don't generate a "picture" via backword ray (or beam tracing) like you do, because it would take too many samples in the forward monte carlo analysis, and of course, GIA's WLR metric doesn't relate directly to any particular "view" of the stone (it is a weighted average), so it doesn't make any sense to plot the average WLR for each point on the stone. I'm just looking at different perspectives of the GIA metric to see if there is information that could be gleaned other than what GIA presented in their studies, and there are some insights to be gained, namely that WLR alone doen't tell the story for Brilliance, but you have to look at the, maybe uniformity of the WLR metric across the stone.

To take a simplistic analogy, you could have a high WLR metric but if it only emenated from one spot on the stone and the rest of the area of the stone was dead black, what the hell good is the metric for assessing the goodness of the cut. This is where all published studies showing contour maps alone have failed miserably, in my opinion. A high total light return with a dead center is meaningless, and misleading to the consumer.

That is why I'm not too impressed with some peoples use or misuse of MSU's (or GIA's) published data, and some patents (like the HCA, sorry Gary). I think these efforts are a good try, but may fall short because they seemingly don't take account of what the stone really looks like.

I hope AGS's methodology doesn't fall into that possible trap..

tolkradial.gif
 

adamasgem

Brilliant_Rock
Joined
May 23, 2003
Messages
1,338
This is why I'm spending my time trying to model what I can photograph, rather than playing with chromatic flares as a measure of Fire.

The composite photo is increased in saturation level for printing and display, from left to right,1) an EightStar, 2) a GIA EX/EX, 3) a branded, 1990's version of "ideal", and 4) your typical mall store off make..

I think a picture is worth a thousand words..

4pics.jpg
 

goodpointz

Rough_Rock
Joined
Mar 29, 2004
Messages
10
Which one of the four images indicates the strongest dispersion? 1 and 3 seem to show the best symmetry, with 3 showing the most color, and 1 showing the most blue and black. Does any color = fire (i.e. more color means more dispersion) or do specific colors (i.e. blue and black) indicate different things? Very interesting photo!
 
Status
Not open for further replies. Please create a new topic or request for this thread to be opened.
Be a part of the community Get 3 HCA Results
Top