shape
carat
color
clarity

Whose Diamonds Look Biggest?

Status
Not open for further replies. Please create a new topic or request for this thread to be opened.
I think it's a great test, with interesting results. I've always read that you're eyes really don't discern anything less thatn a .1mm size difference in stones. I don't know if I agree with that -- I think I am more size sensitive than I am color sensitive, but that what the experts have said. None of these samples have more than a .1mm average variance between each other, but all of those 6.3mm and smaller stones do fall into that camp of visually smaller.

But, before we go so far as to pass judgement on the various vendors based on the results, I think it's fair to say that some might be optimizing to things other than size when they choose their stock. Size is only one of the "5" c's (assuming you take into account cost). I'd trade off a <.1mm here and there for a great looking stone or a great value. That becomes the interesting part of this whole adventure. Picking that balance that works for your priorities.
 
----------------
If you're interested, let me know and I'll be happy to email you the file.----------------


Very interesting. The "average deviation", would that be the mean of absolute differences? Could you post the standard deviations? Or, if possible, send me the file? Thanks a lot,

Scotch
 
----------------
On 6/2/2004 2:26:36 PM leonid wrote:


Diamond..........#1..........#2
Weight:..........1 ct.......1 ct


Table:...........58%........54%
Diameter:........6.51 mm....6.47mm
Depth:...........3.92 mm....3.99 mm
Crown Height:....14.4%......15.8%
Crown Angle:.....34.5°......34.5°
Pavilion Depth:..43.1%......43.1%
Pavilion Angle:..40.75%.....40.75%
Culet:...........Pointed....Pointed
Girdle:..........1.0%/2.7%..1.0%/2.7%

----------------


I see... I kept depth constant and you the angles
rolleyes.gif


Thought, this is easy, but with 1000 wasy to look at things - not really
5.gif


Thanks.
 
you see? stuff like this is exactly why i subscribe to this forum. I LOVE IT!!!
love.gif
9.gif
 
14.gif
wink2.gif
wink2.gif
What on earth is going on here?

Can someone explain it to me??
 
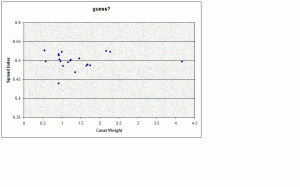
I prepared a similar chart for one particular brand of ideal cuts. Unfortunately I have only twenty datasets for that brand. Guess which brand it is?

Scotch

ideal stats.GIF


----------------
On 6/3/2004 6:24:47 PM whitediamonds wrote:


14.gif
wink2.gif
wink2.gif
What on earth is going on here?

Can someone explain it to me??


----------------
No.......sorry. I'm already spent from trying to explain the difference between a D and a G.
2.gif
 
Scotch, Is it 8*?
 
Right on, Patty, those are Eightstars.
9.gif


Scotch
 
Cool! I just based my guess on which name brand stone you hadn't included and I figured that there are not that many 8*s out there.

I really don't understand your graphs.
3.gif
 
----------------
On 6/3/2004 9:41:30 PM Patty wrote:

Cool! I just based my guess on which name brand stone you hadn't included and I figured that there are not that many 8*s out there.
----------------

Good call Patty.

----------------
squirerad wrote:

More importantly, if one uses more scientific rigors one will find that there is NOT any statistically significant difference between the most "ideal" (SuperbCert) to the least (Hearts on Fire).
----------------


Yes- and no. Based on Superidealist's data, I did a quick statistical analysis: With the exception of A Cut Above (and Eightstar, but I discount that based on the small sample size), all samples of branded ideal cuts have spread index smaller than 6.50, at the 5% level of significance. The worst is HoF, which is significantly (in the statistical sense) smaller than 6.45 (again, at 5% level).

----------------
On 6/3/2004 9:41:30 PM Patty wrote:


I really don't understand your graphs.
3.gif
----------------


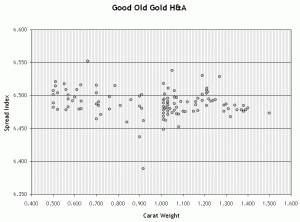
Not sure if I can explain it properly. Superidealist's graphs show the "spread index" plotted against carat weight for different brands. The spread index for a 1 carat diamond is its diameter. For carat weights other than 1 ct, you have to adjust for the difference in size by dividing by (carat weight)^(1/3). For example, if a 2 carat diamond has 8.19mm diameter, the calculation goes: 8.19/(2^1/3)= 6.5 . This way, you can compare diamonds of different carat weights in respect to how big they appear. If another 2ct diamond had a spread index of 6.55, it would have 8.25mm (= 6.55*(2^1/3) )diameter and look like a 2.04ct diamond.

Scotch
 
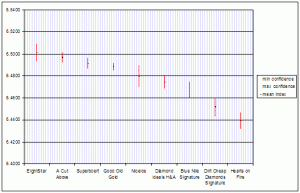
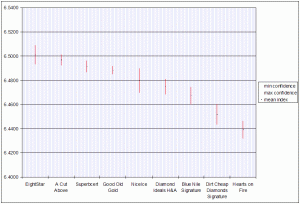
I dug a little deeper, and found a couple more 8star measurements. The sample size is now 29, and since 30 is considered a decent sample size in statistics hypothesis testing, I feel more confident that the comparison will be valid. Below is a chart that plots average spread index and the 95% confidence interval around the mean for the different ideal cut brands. This is based on Superidealists data, plus the 8star sample. The confidence interval is wider for 8star, which reflects the still relatively small sample size, compared to the other brands.

Scotch

Spread chart.gif
 
Scotch...I got it now, thanks! I was confused by the inclusion of stones that were not 1 carat. You show here that the adjustments were made for the various sized stones.

Thanks Superidealist and Scotch...very interesting stuff here!
 
Scoth, cool statistical analyses. A p-value of 0.05 (95% confidence interval) is nothing to laugh at. It's interesting to note that the standard deviation (as demonstrated by the red bars) somewhat correlates with the number of cutters each brand has, at least for SuperbCert and Whiteflash. SC and WC both have one cutter (Barry and Bryan, unless I am totally wrong) so it makes sense that their deviation would be less.


squire
 
----------------
On 6/6/2004 10:40:35 PM squirerad wrote:

Scotch, cool statistical analyses. A p-value of 0.05 (95% confidence interval) is nothing to laugh at. It's interesting to note that the standard deviation (as demonstrated by the red bars) somewhat correlates with the number of cutters each brand has, at least for SuperbCert and Whiteflash. SC and WC both have one cutter (Barry and Bryan, unless I am totally wrong) so it makes sense that their deviation would be less.


squire----------------

Hi Squire,

I'm not sure that is what's going on here. First of all, the red bars indicate confidence intervals, not standard deviation. The length of the confidence interval is 2x(critical value)x(standard error). The critical value depends on the chosen level of significance, here 5%, and is the same for all brands. Standard error is (standard deviation)/squareroot(samplesize). The standard dev. for 8star is 0.02187, for ACA 0.02578, for Superbcert 0.02013, so not much different. All other standard deviations are much higher. However, since the 8star sample has only 29 stones, while the ACA and Superbcert samples have 119 and 65, respectively, the standard error is higher for 8star, despite similar standard deviations.

As far as the cutters are concerned, I don't know how many cutters work for the superbcert brand. I'm fairly sure though Barry doesn't cut the stones himself, there was a discussion about it either here or on DiamondTalk. In the case of ACA, I really have no idea.

It is known that about 10 cutters work for EightStar, producing anywhere between 1000 and 2000 stones annually. Richard von Sternberg would certainly maintain that each EightStar is the same as any other in terms of cut quality, and that may be true as far as e.g. I will ever be able to tell. It would not surprise me, though, if Richard himself could absolutely tell which of his cutters produced a particular stone.

Btw, while I was scouring the net for EightStars , I came across one interesting stone on the Goodoldgold website:

http://www.goodoldgold.com/virtual_gallery.htm

It's the sixth stone in the list. This is how Jonathan describes it: "Here is a certain brand that cuts their H&A's with a shorter star/lower girdle combo..." I was almost sure it is an EightStar, until I found the GIA cert for that stone. Guess what - no mention of EightStar anywhere. Mysterious!
naughty.gif


Scotch
 
My bad, thanks for the clarification. It's been years since I've taken statistics. I need to do some more of
read.gif
.

squire
 
here, you can make it 30.
H VS2 Eightstar

.610 carat
5.50 to 5.52 x 3.35
depth 60.8%
Table 54%
Crown Height 15.52%
Crown Angle 34.4
Pavillion Depth 42.9%
Pavilion Angle 40.9

Not sure if you need more than just the carat weight and spread measurements (at least from reading above i don't think you do, but maybe.) but i included it all anyway.
 
Thanks sylvesterii! I was secretly hoping for that kind of feedback.
9.gif


Scotch
 
How about a spread for princess stones/ on average, what is the spread for such stones withing the .5 to 1.0ct range? I have asked this question in my other post, but no one seemed to know, as princess stones are not as exact as rounds. If someone has the time, the inkling and the stomach for stats, PLEASE HELP!!!

I want to find a large looking "fairly well cut' princess, (more bang for the buck), so the $3000 price range we have would fit a .75-.9ct stone, we just want to find one with good spread...what should we look for???
 
OMG, the only thing funnier than seeing all those spreadsheets is seeing all those responses!


LOL, f&i I love your response,


"Step away from the spreadsheet"


Just before I found pricescope, I had made my own spreadsheet using stats from a bunch of places.


Then, once I found ps, but before I had really gotten into the HCA, I started to make a database!


I kid you not


When I stumbled across the HCA, well, I celebrated!!!


I knew I had found some kindred spirits, all right....
 
Very intersting stuff guys. Although, as was previously mentioned, some of the limitations in the interpretation of the data would be sample size and selection bias.
2.gif
 
Out of curiosity, for the people who are posting information on statistical analyses and performing the analyses, can you let us know what your professions are (or the level of statistics you're familiar with)? I'm just wondering because I run analyses daily in my profession (and especially for my dissertation), and find this thread very amusing.
 
Hi derek,

The one major concern I have is this: the statistics I used for the confidence interval and hypothesis testing assume that the underlying distribution be normal, at least in the limit for large samples. However, we can't be sure of that, as I guess how the diamond is cut is determined at least in part by what rough material the cutter has to work with. From the shape of the rough, there might well be a bias toward deeper cuts with less spread. I presume one has to conciously cut for more spread, sacrificing more rough than for conventional cuts. I find it hard to tell from the graphs.

If the normal assumption would hold, I'd be comfortable even with a size 30 sample. The standard error should take care of that.

Scotch

(researcher, I sent you a PM)
 
.

GOG.gif
 
Here is a new chart, with Superidealist's GoodOldGold data...

Scotch

(The chart came out a little small, I'll try again tomorrow)

ideal_chart2.gif
 
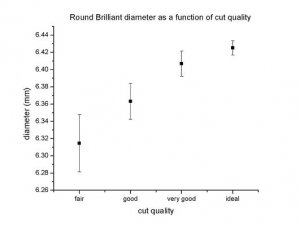
A while ago, I made a graph of average diameter as a function of cut quality using 1ct diamonds from Blue Nile. I used about 20 diamonds for each data point. I thought that I'd post it in this thread again, in case anyone found this interesting
1.gif
...

Graph2.jpg
 
Very interesting. I guess the Blue Nile Signature line must be separate from the plain "ideal" cuts in their regular database. What is BN's definition of their cut grades, does it explicitly say anything about spread?

Scotch

Btw, here's the chart again, a little bigger this time:
Oh, and Holly, have never looked at Princess cut stones, can't help you.
8.gif


Spread chart 2.gif
 
Status
Not open for further replies. Please create a new topic or request for this thread to be opened.
GET 3 FREE HCA RESULTS JOIN THE FORUM. ASK FOR HELP
Top