
How Are Diamonds Made? Natural vs Lab-Created Explained
Two Paths, One Diamond Not all diamonds come from the same place — but they all start the same way. Pure carbon, crystalized under immense pressure and heat. Whether it…
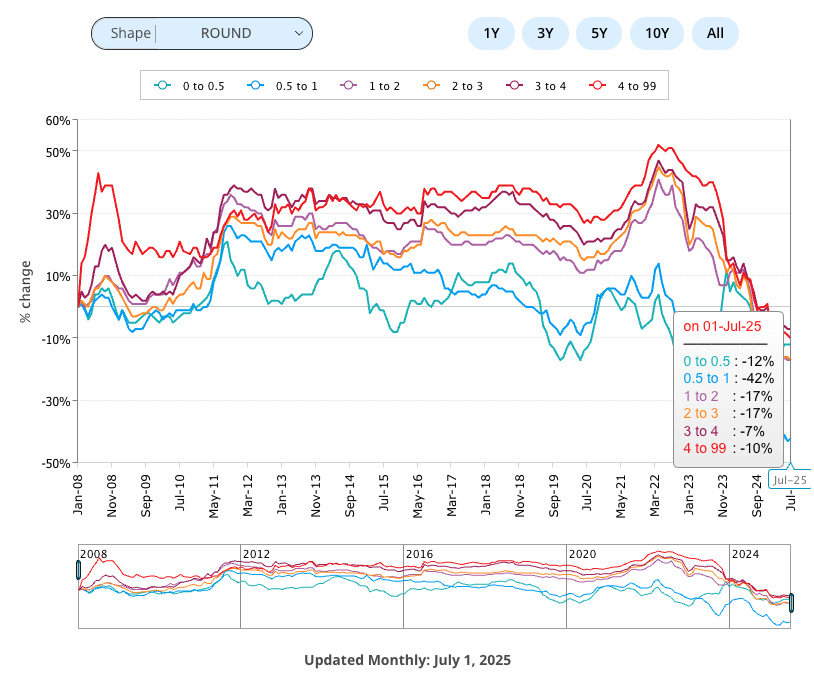
The natural diamond market in July 2025 revealed renewed strength in premium-grade stones, continued volatility in mid-range offerings, and lingering pressure on lower-grade diamonds. As competition from lab-grown diamonds intensifies, July’s data underscores a market in transition. Value, rarity, and shifting consumer behavior continue to drive price movements across categories.
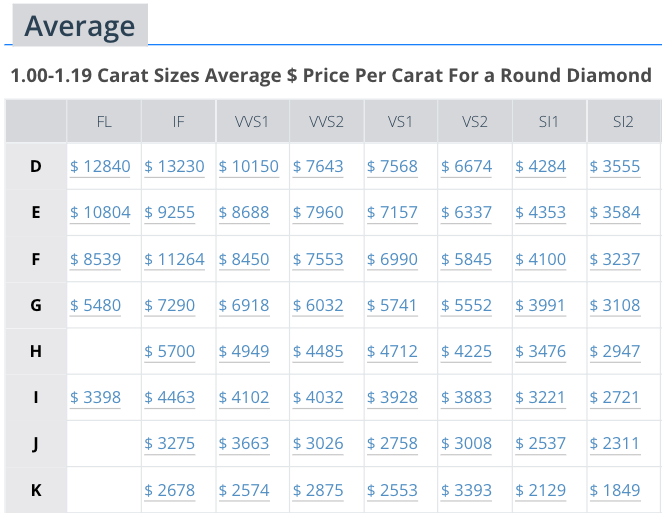
Premium diamonds demonstrated stronger performance in July. D/FL prices increased modestly to $12,840 from $12,586, while D/IF held firm at $13,230, slightly above June’s figure of $13,224. E/FL and E/IF also posted marginal increases, suggesting steady demand for flawless and internally flawless stones. Notably, F/IF surged from $8,128 to $11,264, marking a significant jump that may reflect either reclassification or a rise in demand for very high-clarity diamonds.
These movements indicate a subtle resurgence in consumer and investor confidence at the upper end of the market. Despite ongoing pressures in other segments, buyers continue to favor premium quality. This reaffirms the enduring value proposition of natural diamonds at the highest clarity levels.
Mid-range clarity and color combinations presented mixed results in July. F/VVS2 increased sharply to $8,450 from $7,560, reflecting a stronger interest in diamonds that offer a balance of high clarity and accessible pricing. In contrast, H/VS1 softened slightly to $4,712 from $4,759, while E/VVS2 dipped to $7,960 from $8,053. G/VS1 and G/VS2 also experienced marginal adjustments, indicating fluctuating demand.
Overall, the mid-range segment continues to attract steady interest. Buyers appear more discerning, seeking optimal value within this quality tier. These shifts reflect heightened price sensitivity and greater comparisons to lab-grown alternatives that provide similar visual appeal at lower costs.
Lower-grade diamonds remained under pressure in July, although a few segments showed tentative signs of stabilization. I/SI1 slipped to $3,221 from $3,349, and J/SI1 edged down slightly to $2,537 from $2,550. However, K/SI2 recorded a modest increase, climbing from $1,834 to $1,849, suggesting early signs of resilience at the entry-level.
Despite these slight movements, the broader trend in lower-grade stones continues to point toward cautious consumer spending. Price-conscious shoppers increasingly favour lab-grown options that offer more carat weight for less investment.
The July trends reflect a market divided by clarity and price tier. Premium stones are regaining traction, supported by niche demand and the lasting prestige of high-quality natural diamonds. Mid-range diamonds are undergoing subtle realignment as consumers evaluate value more closely. Lower-grade diamonds remain challenged, although some categories hint at recovery.

Retail Diamond Prices Chart Updated Monthly.
Two Paths, One Diamond Not all diamonds come from the same place — but they all start the same way. Pure carbon, crystalized under immense pressure and heat. Whether it…

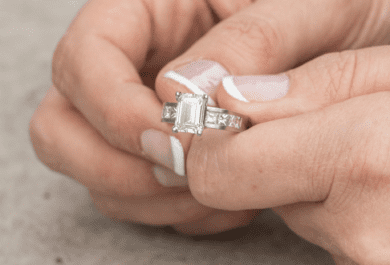
A Wedding Ring as Unique as Your Love Finding the right wedding ring isn’t just about diamonds or gold – it’s about finding the one that feels right. With hundreds…
So, you’re thinking about lab-grown diamonds? Smart move. They’re just as sparkly as the natural kind but usually cost less. But where do you actually go to buy them? It…
 is an easy tool that analyzes the data of round diamonds and calculates a score that grades cut quality.")