shape
carat
color
clarity

Letter to the Editor of the Australian Gemmologist

Status
Not open for further replies. Please create a new topic or request for this thread to be opened.

RockDoc

Ideal_Rock
Joined
Aug 15, 2000
Messages
2,509
Michael wrote:


One of my interests is appraising. Appraisers have a vested interest in understanding both GIA’s and AGS’s cut grading in order to do a proper analysis, just as they need to understand the grading systems for color and clarity.
_________________________________________


It appears that you don''t want to make the investment, that is needed to be able to render the predictions for the AGS cut grading.

I think most appraisers have, microscopes, that they use which have become their "right hand". If you walked into a gemologist/appraiser office and he/she only used a loupe and a set of CZ masters, I think most consumers who "appraised the appraiser" wouldn''t use the services of such a person.

With technology changing the way it has, the non contact proportion machine, and the AGS software is really necessary.

Then there is the committment to rendering the information that consumers want. I''ve made this investment for this equipment and more. As a result I am able to comfortably render these reports.

I don''t understand why a cutter wouldn''t add these items to his equipment, as well as jeweler or appraiser. Sure it is a lot of expense, but it provides consumers with the knowledge and confidence in one''s services, that they are on the level that they want. After all we do charge for this kind of work.

I guess my suggestion for you is if you want to appraise and analyze item to the extent that you want, bite the bullet and get the tools you need to do what you want. Increase your fees to pay off the investment.

I can tell you from working with these items, that it is more complex than using a chart or graph.... and in time as technology improves, you''ll be able to produce an even more detailed and accurate analysis, that without the items - is impossible to do.

I can''t see how making a chart in order to issue a grade can work. GIA''s charts, which I bought, basically do nothing more than take up space on the wall, and the computerized system of rounding up and using proportions that aren''t ACTUAL as the report says, can only end up with anyone using it, having the egg all over their face that GIA''s system does.

I''ve heard that the GIA computer program to do this costs $ 3000.00 plus a yearly fee.....AGS is a lot less, but still not a drop in the bucket, and it is certainly comprehensive an analysis.


Rockdoc


michaelgem

Shiny_Rock
Trade
Joined
Feb 26, 2003
Messages
379
It appears that you don''t want to make the investment, that is needed to be able to render the predictions for the AGS cut grading.

I don''t understand why a cutter wouldn''t add these items to his equipment, as well as jeweler or appraiser. Sure it is a lot of expense, but it provides consumers with the knowledge and confidence in one''s services, that they are on the level that they want. After all we do charge for this kind of work.

I can tell you from working with these items, that it is more complex than using a chart or graph.... and in time as technology improves, you''ll be able to produce an even more detailed and accurate analysis, that without the items - is impossible to do.

Rockdoc
Hi Rock,

I edited your post to reply to what I think are your most important comments.

Having made the investement of time and expense that you have in buying and learning to use the equipement and software, you are in great shape from the analysis view point.

I recall hearing the rantings of an irate CGA appraiser at the AGS booth in Tucson. He was not about to spend thousands on a Sarin and PGS software, and he was giving Jim Caudill a ''piece of his mind''.

Most of us will agree with you that everyone who can afford to should make that investment of time and expense.

There are also many, including Sergey and I, who will say that a system of that complexity, requiring a Sarin and computer analysis, needs to be simplified using techniques such as the charts in order to enable it to be taught, understood and accepted by cutters, appraisers, jewelers, and savvy consumers.

Michael Cowing
 

michaelgem

Shiny_Rock
Trade
Joined
Feb 26, 2003
Messages
379

With all my long winded efforts to explain my reasoning and concerns, the key following wisdom by Sergey and question by me has been buried.


Take software such as PGS, and check different combinations of parameters, print it. You will have created a chart. Charts are just more effective for human analysis. Human analysis is very important for developing the cutter’s strategy. Sergey


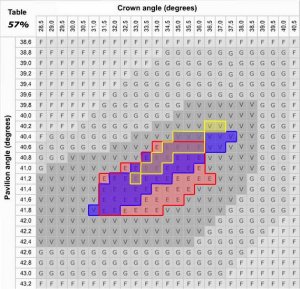
The updated guideline charts would give the cutter a better idea of where to play in the Ideal 0 sandbox with less probability of falling out.


Ask yourself, if I were a cutter working with a variety of rough and wanting AGS''s blessing of an Ideal 0 for my diamonds, would I be better off knowing the current guideline range of zero (yellow) or the actual PGS range (blue)?


With Peter graciously offering the PGS software to Sergey, the accuracy of this chart can be verified.

What do you all think?
Michael Cowing


Ideal-0-range.jpg
 

adamasgem

Brilliant_Rock
Joined
May 23, 2003
Messages
1,338
Date: 3/11/2007 9:55:20 AM
Author: michaelgem
Hi Rock,

I recall hearing the rantings of an irate CGA appraiser at the AGS booth in Tucson. He was not about to spend thousands on a Sarin and PGS software, and he was giving Jim Caudill a ''piece of his mind''.

Most of us will agree with you that everyone who can afford to should make that investment of time and expense.

There are also many, including Sergey and I, who will say that a system of that complexity, requiring a Sarin and computer analysis, needs to be simplified using techniques such as the charts in order to enable it to be taught, understood and accepted by cutters, appraisers, jewelers, and savvy consumers.

Michael Cowing
Michael
I can partially empathise with you regarding the costs issues, however, whatever the driver, including consumers who want the very best, light performance analyses are here to stay.

The non contact mesurement device issue is largely being solved by sellers who provide the consumers with either the results, and or Sarin/Helium/Ogi mesuarement files via the internet. Perhaps that data may even, in the near future, be translated to a magnetic credit card format, so that the stones fingerprint be part of the "paper", or evry lab will keep an online database of the non contact measurement of a stone, accesable via the internet, such that improvements in technology as to analyses, can be applied.

Most manufacturers and labs have long ago invested in non contact technology, which is easily amortized to a small per stone cost, to either gian knowledge of what they need to do from the initial planning stages to their finished product, or as a tracker for memo goods.

Probably the vast majority of goods sold in the world, are sold without "paper", or anything more than a casual "trust me, you are getting a deal" type of assurances, along with other forms of puffery. Most jewelers will invest more in the fluff and BS advertizing, than in real technology to help know or sell their products, or else they rely on "paper", good or bad, mostly bad, to accomplish their goals.

Regarding analysis software, development and research costs have to be amortized, so software costs can be high, unless the potential market is huge, like with a movie DVD. How many tes of millions of dollars were spent by GIA to generate a dumbed down system, which needs measurements, however obtained.

How much time will you spend making measurements under a microscope to apply the GIA system, and who is paying for that time, your clients in the end; either by costs involved with your overhead and instrumentation, or by your time spent, so the $$ arguments are a wash on that issue.

Just as I can agree or disagree with some techniques applied by GIA, I can also do the same with AGS, but since there is a two way interchange with AGS, I can do that privately.

I think software should should be sold, ether on a time unlimited basis, or per use basis, such that the small user can have the same availability as the large user. Protection keys can be programmed either way. I think the current pricing method should be changed. If upgrades are offered, then you pay for them, if you want them.

An appraiser can choose to provide what level of analysis his client base prefers, and they do, and the client base will seek what they want.

If you want to present opinions to a client based on the hypothetical "idealized stone" averaged parameter stone, then you better inform them in writing that that is what you are doing.

If you want to provide "provisional" AGS analyses, then you have to do it correctly, and to their standards.

Only AGSLAB can issue AGS "Grades", just as only GIA/GTL can issue "GIA Grades".

BTW, try to explain to clients, the "taste test", and what part it is of the "GIA Grade".

Or the differences in level of opinions, where maybe 14% of RBC''s would qualify for AGS 0 and 65% would qualify for GIA "EX", based on polish and symmetry alone.

Sergey has presented one spreadsheet for the mean AGS deduction for a perfectly physically, and thus optically symmetrical stone.

He, or you, has not examined the statistics of how that deduction would vary, based on the lack of optical symmetry

In a RBC you have 57 planes, excluding the girdle facets, each minimally defined with three parameters (tilt azimuth and distance), That is a minimal 171 by 171 correlated matrix necessary for defining rudimentary optical symmetry, at each and every set of reference symmetrical idealized point.

How many computer years and $$ were spent by GIA just to do their "idealized" analyses, without asymmetries?

Not an easy job to provide what you would need to do what I think you want to do, have a set of charts you could use for grading. Every wonder why GIA had to use the "taste test" to bring their symmetrical stone analyses in line, i.e. correlated with, their taste test results and their final "grade"? Let alone the minimal amount of stones used.
 

adamasgem

Brilliant_Rock
Joined
May 23, 2003
Messages
1,338
Date: 3/11/2007 1:48:31 PM
Author: michaelgem

With all my long winded efforts to explain my reasoning and concerns, the key following wisdom by Sergey and question by me has been buried.


Take software such as PGS, and check different combinations of parameters, print it. You will have created a chart. Charts are just more effective for human analysis. Human analysis is very important for developing the cutter’s strategy. Sergey


The updated guideline charts would give the cutter a better idea of where to play in the Ideal 0 sandbox with less probability of falling out.


Ask yourself, if I were a cutter working with a variety of rough and wanting AGS''s blessing of an Ideal 0 for my diamonds, would I be better off knowing the current guideline range of zero (yellow) or the actual PGS range (blue)?


With Peter graciously offering the PGS software to Sergey, the accuracy of this chart can be verified.

What do you all think?

Michael Cowing
With only 14%, give or take, of stones probably able to meet those nominal guidelines, based on polish or symmetry alone, how usefull or misleading will (could) your charts be?
 

RockDoc

Ideal_Rock
Joined
Aug 15, 2000
Messages
2,509
Date: 3/11/2007 1:48:31 PM
Author: michaelgem

With all my long winded efforts to explain my reasoning and concerns, the key following wisdom by Sergey and question by me has been buried.


Take software such as PGS, and check different combinations of parameters, print it. You will have created a chart. Charts are just more effective for human analysis. Human analysis is very important for developing the cutter’s strategy. Sergey


The updated guideline charts would give the cutter a better idea of where to play in the Ideal 0 sandbox with less probability of falling out.


Ask yourself, if I were a cutter working with a variety of rough and wanting AGS''s blessing of an Ideal 0 for my diamonds, would I be better off knowing the current guideline range of zero (yellow) or the actual PGS range (blue)?


With Peter graciously offering the PGS software to Sergey, the accuracy of this chart can be verified.

What do you all think?

Michael Cowing

Michael

The chart only shows crown measurement angle and a pavilion measurement angle.

I will grant you that I am a computer grape, but even to this compu-limited mind, the chart doesn''t cover all the characteristics that are analyzed by the PGS software. Where do the following characteristics get analyzed in the chart above?

Contrast
Dispersion
Spread
Variances due to azimuth / yaw of the facets
Variances due to the level of optical symmetry
Girdle differences
Lower girdle lengths
Upper Girdle measurements
Polish quality or lack thereof
Symmetry exactness (especially for out of round or symmetrical stones
Non centering of the table
Non centering of the culet.... which can result in the stone being lopsided, especially with princess/emerald cuts or other fancy shaped stones that will eventually become cut grade analyzed?

There are probably more instances to list, but those are the ones I could think up quickly.

My opinion on this is that you''re trying to make an 18 wheeler run on only 2 wheels.

Simplistic???? Probably.... but most people don''t want simplistic - they want complete, thorough, and exhaustive information when they are buying an item that costs thousands of hard earned dollars.

As for the position of valuing..... Since little details have significant affect on the value, how can you make a viable value conclusion based on only crown and pavilion data???

Michael, you were the scientific consultant and expert to Eightstar with an engineering degree and FGA. Knowing the technology of the approach that Eightstar took in the development of the Eightstar Diamond, I have to say I am surprised at the position you''ve taken here.

Respectfully,

Rockdoc
 

michaelgem

Shiny_Rock
Trade
Joined
Feb 26, 2003
Messages
379
Rock,

The closing "respectfully" really does not apply to your post.

With this one post you have shown that you choose to ignore everything that Sergey and I said. But I will go over your list categorically:

Where do the following characteristics get analyzed in the chart above?

Contrast - This is an aspect that is measured, not one of the diamond’s parameters

Dispersion - an aspect that is measured, not one of the diamond’s parameters

Spread - an aspect that is measured, not one of the diamond’s parameters

Variances due to azimuth / yaw of the facets – There are no variances. These are charts of idealized diamonds with normal indexing. They are approximated only by the best cutters like Paul.

Variances due to the level of optical symmetry – These are optically symmetrical diamonds with no variance.

Girdle differences – These charts are for a “3.5% girdle thickness at the mains”

Lower girdle lengths – These charts are for a “50% lower girdle length”

Upper Girdle measurements – These charts are for a “50% star length”

Polish quality or lack thereof – Idealized diamonds have ideal polish

Symmetry exactness, Non centering of the table, Non centering of the culet - Idealized diamonds have ideal symmetry

It is strange that you dodge my question and everything I have carefully said in this way.

Michael Cowing

PS It should be apparent that two dimensional charts, one for each table size, can only vary two of the idealized diamond's seven parameters.


Date: 3/11/2007 3:33:49 PM
Author: RockDoc

Michael

The chart only shows crown measurement angle and a pavilion measurement angle.

I will grant you that I am a computer grape, but even to this compu-limited mind, the chart doesn't cover all the characteristics that are analyzed by the PGS software. Where do the following characteristics get analyzed in the chart above?

Contrast
Dispersion
Spread
Variances due to azimuth / yaw of the facets
Variances due to the level of optical symmetry
Girdle differences
Lower girdle lengths
Upper Girdle measurements
Polish quality or lack thereof
Symmetry exactness (especially for out of round or symmetrical stones
Non centering of the table
Non centering of the culet.... which can result in the stone being lopsided, especially with princess/emerald cuts or other fancy shaped stones that will eventually become cut grade analyzed?

There are probably more instances to list, but those are the ones I could think up quickly.

My opinion on this is that you're trying to make an 18 wheeler run on only 2 wheels.

Respectfully,

Rockdoc


michaelgem

Shiny_Rock
Trade
Joined
Feb 26, 2003
Messages
379
Date: 3/12/2007 9:38:52 AM
Author: michaelgem

Rock,

The closing ''respectfully'' really does not apply to your post.

With this one post you have shown that you choose to ignore everything that Sergey and I said. But I will go over your list categorically:

Where do the following characteristics get analyzed in the chart above?

Contrast - This is an aspect that is measured, not one of the diamond’s parameters

Dispersion - an aspect that is measured, not one of the diamond’s parameters

Spread - an aspect that is measured, not one of the diamond’s parameters

Variances due to azimuth / yaw of the facets – There are no variances. These are charts of idealized diamonds with normal indexing. They are approximated only by the best cutters like Paul.

Variances due to the level of optical symmetry – These are optically symmetrical diamonds with no variance.

Girdle differences – These charts are for a “3.5% girdle thickness at the mains”

Lower girdle lengths – These charts are for a “80% lower girdle length” TYPO

Upper Girdle measurements – These charts are for a “50% star length”

Polish quality or lack thereof – Idealized diamonds have ideal polish

Symmetry exactness, Non centering of the table, Non centering of the culet - Idealized diamonds have ideal symmetry

It is strange that you dodge my question and everything I have carefully said in this way.

Michael Cowing

PS It should be apparent that two dimensional charts, one for each table size, can only vary two of the idealized diamond''s seven parameters.


Date: 3/11/2007 3:33:49 PM
Author: RockDoc

Michael

The chart only shows crown measurement angle and a pavilion measurement angle.

I will grant you that I am a computer grape, but even to this compu-limited mind, the chart doesn''t cover all the characteristics that are analyzed by the PGS software. Where do the following characteristics get analyzed in the chart above?

Contrast
Dispersion
Spread
Variances due to azimuth / yaw of the facets
Variances due to the level of optical symmetry
Girdle differences
Lower girdle lengths
Upper Girdle measurements
Polish quality or lack thereof
Symmetry exactness (especially for out of round or symmetrical stones
Non centering of the table
Non centering of the culet.... which can result in the stone being lopsided, especially with princess/emerald cuts or other fancy shaped stones that will eventually become cut grade analyzed?

There are probably more instances to list, but those are the ones I could think up quickly.

My opinion on this is that you''re trying to make an 18 wheeler run on only 2 wheels.

Respectfully,

Rockdoc


adamasgem

Brilliant_Rock
Joined
May 23, 2003
Messages
1,338
Date: 3/12/2007 9:38:52 AM
Author: michaelgem

Rock,

The closing ''respectfully'' really does not apply to your post.
So I''ll respond to you with very little respect.
41.gif


With this one post you have shown that you choose to ignore everything that Sergey and I said. But I will go over your list categorically:

Where do the following characteristics get analyzed in the chart above?

Contrast - This is an aspect that is measured, not one of the diamond’s parameters
Contrast is analyzed, not measured

Dispersion - an aspect that is measured, not one of the diamond’s parameters
Dispersion is analyzed, not measured

Spread - an aspect that is measured, not one of the diamond’s parameters
Spread is analyzed, not measured

Variances due to azimuth / yaw of the facets – There are no variances. These are charts of idealized diamonds with normal indexing. They are approximated only by the best cutters like Paul.
I note that you say approximated, so the charts you want may apply to the 23% of stones that might get EX symmetry.

Variances due to the level of optical symmetry – These are optically symmetrical diamonds with no variance.
So the charts you want MAY apply to the 23% of stones that might get EX symmetry.


Girdle differences – These charts are for a “3.5% girdle thickness at the mains”

So the charts you want MAY apply to the 23% of stones that might get EX symmetry.


Lower girdle lengths – These charts are for a “50% lower girdle length”
So the charts you want MAY apply to the 23% of stones that might get EX symmetry.

A 1 or 2% difference for LGF in a SYMMETRICAL stone can give you 2 AGS grades difference in light performance on the borders you are pleading to include. I ran some of Storm''s requested situations. GIA rounds the averages to the nearest 5%.


Upper Girdle measurements – These charts are for a “50% star length”
1 or 2% differences for stars in a symmetrical stone can give you AGS grade differences in light performance on the borders you are pleading to include.


Polish quality or lack thereof – Idealized diamonds have ideal polish
About 28% of stones or less would qualify for AGS 0 polish, based on GIA stats for EX polish

Symmetry exactness, Non centering of the table, Non centering of the culet - Idealized diamonds have ideal symmetry
So the charts you want MAY apply to the 23% of stones that might get EX symmetry.

It is strange that you dodge my question and everything I have carefully said in this way.
It is NOT SO STRANGE how you continually dodge reality and the VERY GOOD reasons why the AGS guideline charts were set conservatively in the manner they were.
35.gif


Michael Cowing
 

michaelgem

Shiny_Rock
Trade
Joined
Feb 26, 2003
Messages
379
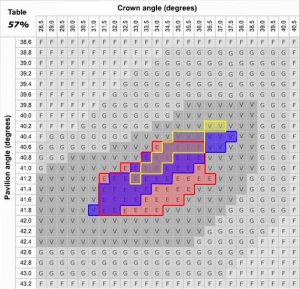
Have another look folks. Like Sergey said "Take software such as PGS, and check different combinations of parameters, print it. You will have created a chart. Charts are just more effective for human analysis. Human analysis is very important for developing the cutter’s strategy."

What can we learn about cutting strategy from this 57% table chart for a 6mm, 50%sl, 80%lg, 3.5%girdle optically symmetric diamond?

If I were a cutter I would be interested in knowing that this chart indicates that the center of the ''sweet spot'' for Ideal 0 according to the AGS-PGS is 41.1, 34.25 not the AGS guideline charts center of 40.7, 35.

I would also be interested in knowing that the guideline indication that it is safe to cut Ideal 0 combinations of 40.2, 36.5 and 40.2, 37 is no longer true.

I would also be interested in knowing that I can cut a 41.6, 32.25 with decent leeway even though the guideline charts guide me away from that combination.

I would also be interested in knowing that I can cut a 40.5, 36.75 and get an Ideal 0 even though the guideline charts also guide me away from that combination.

Michael Cowing

Ideal-0-range2.jpg
 

adamasgem

Brilliant_Rock
Joined
May 23, 2003
Messages
1,338
Date: 3/12/2007 12:41:45 PM
Author: michaelgem

If I were a cutter I would be interested in knowing that this chart indicates that the center of the ''sweet spot'' for Ideal 0 according to the AGS-PGS is 41.1, 34.25 not the AGS guideline charts center of 40.7, 35.

I''d like to know how you figured that "brilliant piece" of logic out, especially when you have insufficient published information to do so. I think you have to go back to the books to learn what data tells you and what it can''t tell you.

By "sweet spot", people MIGHT assume that you have found the real maximal performance, and since the AGS PGS is a threshold system, you are never presented with the information necessary to make that statement. Or is that your misguided intent?.

BTW, Sergey only rates it as a 1.0, 0.99, 0.99, right in the middle of his Very Good Range 0.9 to 1.1

AND, the geometric "center" of the AGS chart DOES NOT INDICATE THE "SWEET SPOT", or point of maximal performance, as you have no idea of the impending performance deduction gradients below the PGS threshold for starting to give deductions at a symmetrical point, or the sensitivities to the typical assymetries at that point.

Michael Cowing
 

strmrdr

Super_Ideal_Rock
Joined
Nov 1, 2003
Messages
23,295
sheesh this still going on...
ok I''m going to give it another go...
Marty had my combos ran that proves a 3 or 4 dimensional chart can not give you enough data.
57% table 80% lgf% crown angle pavilion angle are not enough data to assign a grade even in an idealised stone very much less so a real world one.

Looking at how the old "cutting guidelines" are being tossed around and misused in this thread its a no brainer that they will not release new ones.

1beb8b2ae6d61633f35d740313c6c610.gif
 

michaelgem

Shiny_Rock
Trade
Joined
Feb 26, 2003
Messages
379
Date: 3/12/2007 12:41:45 PM
Author: michaelgem
Have another look folks. Like Sergey said ''Take software such as PGS, and check different combinations of parameters, print it. You will have created a chart. Charts are just more effective for human analysis. Human analysis is very important for developing the cutter’s strategy.''

What can we learn about cutting strategy from this 57% table chart for a 6mm, 50%sl, 80%lg, 3.5%girdle optically symmetric diamond?

If I were a cutter I would be interested in knowing that this chart indicates that the center of the ''sweet spot'' for Ideal 0 according to the AGS-PGS is 41.1, 34.25 not the AGS guideline charts center of 40.7, 35.

I would also be interested in knowing that the guideline indication that it is safe to cut Ideal 0 combinations of 40.2, 36.5 and 40.2, 37 is no longer true.

I would also be interested in knowing that I can cut a 41.6, 32.25 with decent leeway even though the guideline charts guide me away from that combination.

I would also be interested in knowing that I can cut a 40.5, 36.75 and get an Ideal 0 even though the guideline charts also guide me away from that combination.

Michael Cowing
Strm,

This was an example of what we and the cutters would learn from updated guideline charts. Until they are updated, I can only go by these charts from Sergey''s study group. This exercise illustrates the kind of use it can be put to when Sergey gets the PGS software and creates similar but more definitive charts.

Do you believe Sergey is wrong when he says: "Charts are just more effective for human analysis. Human analysis is very important for developing the cutter’s strategy."?

Michael
 

strmrdr

Super_Ideal_Rock
Joined
Nov 1, 2003
Messages
23,295
Date: 3/12/2007 7:16:36 PM
Author: michaelgem


Do you believe Sergey is wrong when he says: 'Charts are just more effective for human analysis. Human analysis is very important for developing the cutter’s strategy.'?

Michael
well there is a difference when a cutter gets a grade he didn't expect miss/using the charts they can say they aren't ours we said they cant do the job.
Where if AGS release them and it don't get the grade they are going to have a very mad cutter.
And that is what is going to happen if a cutter relies on charts in my opinion.

Smart move by Peter/AGS
36.gif
 

adamasgem

Brilliant_Rock
Joined
May 23, 2003
Messages
1,338
Date: 3/12/2007 7:16:36 PM
Author: michaelgem
Strm,

This was an example of what we and the cutters would learn from updated guideline charts. Until they are updated, I can only go by these charts from Sergey''s study group. This exercise illustrates the kind of use it can be put to when Sergey gets the PGS software and creates similar but more definitive charts.

Do you believe Sergey is wrong when he says: ''Charts are just more effective for human analysis. Human analysis is very important for developing the cutter’s strategy.''?

Michael
No Michael, this was just another example of you trying to spin your incorrect and misleading assumptions, without admitting you are wrong from the start, let alone specific examples, and wasting everyones time with your whining (Sorry Wink, he deserves it)


michaelgem

Shiny_Rock
Trade
Joined
Feb 26, 2003
Messages
379
Date: 3/12/2007 7:41:36 PM
Author: strmrdr

Date: 3/12/2007 7:16:36 PM
Author: michaelgem


Do you believe Sergey is wrong when he says: ''Charts are just more effective for human analysis. Human analysis is very important for developing the cutter’s strategy.''? No answer, just a well?

Michael
well there is a difference when a cutter gets a grade he didn''t expect miss/using the charts they can say they aren''t ours we said they cant do the job. If they can''t do the job, why are they called cutting guideline charts?
Where if AGS release them and it don''t get the grade they are going to have a very mad cutter.
And that is what is going to happen if a cutter relies on charts in my opinion.

Smart move by Peter/AGS
I don''t see that it''s true, but If your opinion is right, AGS logically should recall the guideline charts, since they can''t do the job of guiding.

On the other hand, my exercise demonstrates that the cutter is very much more likely to get a grade he didn''t expect trying to use the current charts than if he was given the updated charts. With updated charts at least he would know that two of the combinations, which the current chart guides him to use, are now outside the Ideal 0.

If AGS leaves the old charts out there, it seems logical for a cutter to suppose that the charts are what AGS says they are, cutter guidelines. If he uses the old guideline charts you are very much more likely to have a very mad cutter than if he used the same charts generated with PGS.

Michael
 

egs1

Rough_Rock
Joined
May 2, 2006
Messages
30
From an outsider with no clue about diamonds...it would appear than the current charts showing only limited proportions (but not all) that will receive AGS 0 are only penalising the best cutters.

Wouldn''t a really good cutter want to know all proportions that if he cut a diamond perfectly would get AGS 0...that way he can maximise value? It appears that the currrent proportions on the charts that receive AGS 0 if cut badly won''t receive AGS 0 anyway, so why not be consistent and show all potential AGS 0''s?
 

strmrdr

Super_Ideal_Rock
Joined
Nov 1, 2003
Messages
23,295
ok so a smart cutter wants to cut ags0 stones what does he do....

1: hire Paul as a consultant.
2: talk to AGS
3: figure out what his typical rough will best cut as and balance that against the cut guidelines staying well within the boarders while also staying within the GIA EX window.
4: then cut some low color/clarity rough into test stones to verify his production methods.
5: run them against the PGS software
6: submit them to AGS for grading
7: ramp up production slowly send the ags1's to GIA for an EX grade.
????
profit!
 

michaelgem

Shiny_Rock
Trade
Joined
Feb 26, 2003
Messages
379
Date: 3/13/2007 1:08:48 AM
Author: egs1
From an outsider with no clue about diamonds...it would appear than the current charts showing only limited proportions (but not all) that will receive AGS 0 are only penalising the best cutters.

Wouldn''t a really good cutter want to know all proportions that if he cut a diamond perfectly would get AGS 0...that way he can maximise value? So why not be consistent and show all potential AGS 0''s?
Thank you egs1.

Michael
 

michaelgem

Shiny_Rock
Trade
Joined
Feb 26, 2003
Messages
379

I notice that Leonid has also grown tired of this thread and is letting it fade.


When my “Diamond Brilliance” article came out in 2000 many opposed my work and ideas in a fashion similar in some ways to this thread. Back then I was making an engineering and scientific contribution to knowledge about diamond brilliance, its perception, and its measurement. But I was seen to be attacking GIA and bucking the prevailing beliefs on the Diamondtalk forum. The reaction was similar to the reaction by some on Pricescope to my AGS chart concerns. Instead of considering my thinking there was only an effort on Diamondtalk to have it rejected.


Reminds me of a seminar I attended at an NAJA conference about dealing with lawyers as an expert witness. It’s said that the apposing lawyers have no interest in whether the expert witness testimony is right or wrong. The lawyers are only interested in finding ways to attack the expert''s credibility to prevent him and his testimony from ever being heard or considered.


What I have tried to do here is simply encourage a greater understanding of the AGS grading system through the vehicle of updated guideline charts. I recognize their limitations and the dangers in too great a reliance on them. But I also recognize the wisdom in Sergey’s words: "Charts are just more effective for human analysis. Human analysis is very important for developing the cutter’s strategy."


Clearly, from the 2000 article and my subsequent posts to these forums, I am no more an opponent or proponent of GIA or AGS.


I am, however, an opponent of attitudes, beliefs and characterizations that one grading system sucks and the other can do no wrong.


I am a proponent of greater understanding of the perception of diamond beauty and what cutting strategies bring out the best of the attributes of diamond beauty: brilliance (brightness and contrast), fire and scintillation.


Michael Cowing
 

adamasgem

Brilliant_Rock
Joined
May 23, 2003
Messages
1,338
Date: 3/13/2007 1:08:48 AM
Author: egs1
From an outsider with no clue about diamonds...it would appear than the current charts showing only limited proportions (but not all) that will receive AGS 0 are only penalising the best cutters.

Wouldn''t a really good cutter want to know all proportions that if he cut a diamond perfectly would get AGS 0...that way he can maximise value? It appears that the currrent proportions on the charts that receive AGS 0 if cut badly won''t receive AGS 0 anyway, so why not be consistent and show all potential AGS 0''s?
egs1.. If there is only, let''s say a 1% probability that a cutter would get that grade, at that T,CA,PA point, because of cutting assymetries, would that do the cutter any better than charts, based on , let''s say, a 90% probability of getting that "grade".

That is what this little discourse has been about.

The thread started out with GIA''s rebuttal letter saying that AGS had 11 grades and GIA 5 grades, maybe implying, wrongly, that there are 2.2 AGS grades within the GIA EX cut grade range, based on the implied linear correlation.

However GIA charts are based on (half-assed) Rounded, averaged, asymmetric stones and AGS charts based on perfectly symmetric stones.

In the real world, only the better cut goods are sent to AGS and GIA, a small percentage of the total stones cut worldwide.

Even at that, and with a limited sample set (69000+) of RBC''s, it has been shown that 65% of goods submitted would fall within the GIA paradigm of EX/EX for polish and physical symmetry. This can be verified by any general data base.

Now we KNOW that AGS requires a 0 polish, nad could maybe imply that GIA EX polish includes AGS 0 and 1 polish

We do KNOW, for example, that a 2 to 3% change in LGF is sufficinet to change the AGS grade by 2 grades at specific points.

We don''t really know that a GIA EX physical symmetry is equivilent to a AGS 0,1 and possibly part of 2 AGS physical symmetry.

Based on that, and the statitistics that only ~14% of GIA stones get a GIA combined EX/EX, we could imply that only 14% OR LESS of GIA EX/EX''s would qualify as AGS 0 and 0 for polish and physical symmetry.

What we DON''T KNOW, is the non-linear relationship between multi variate physical symmetry (assymetry) and the AGS
optical performance deductions, at each and every "chart parameter set" (Table %,Crown Angle,Star%, Upper Girdle Facet Painting, Girdle%, Lower Girdle Facet Digging, LGF Length, Pavilion angle, Culet %) Millions of data sets would be needed, maybe hundreds at EACH basic parameter set (Table %,Crown Angle,Star%, Upper Girdle Facet Painting, Girdle%, Lower Girdle Facet Digging, LGF Length, Pavilion angle, Culet %)

Given the relatively small percentage of stones that AGS grades, relative to the 1000# Gorilla on the block, I seriously doubt that AGS has the requisite database to do the statistical analysis necessary to answer the above question, and even if they had GIA''s database, there still might not be enough information in it to create "better charts" within some stated probability limits.

Yes, some stones outside the AGS cutters guideline charts MIGHT get a better overall grade than shown, just as some stones within the cutters guideline charts HAVEN''t got the grade inplied by the simplistic (T,CA,PA) charts.
 

oldminer

Ideal_Rock
Trade
Joined
Sep 3, 2000
Messages
6,696
Seems to me that charts, regardless of how detailed and complex, cannot convey the necessry requirements to GRADE any particular diamond correctly all the time. There are quite a few small details of cut which are not addressed by even the most complex devices which measure facets and features of diamonds. These small measures or features do have an effect on how well a diamond performs and how it ought to be GRADED.

Charts are very good for guiding cutters to a reasonable range of financial and light performance expectations. The most accurate charts combined with the best cutters will foster the most positive end results. There is science and art involved in successful diamond cutting. Surely, these charts are useful and will eventually be revised and refined to be even better over time.

Although we may be a long way from a consensus on the lighting model, I believe this long thread is proving a point of view I have expressed many times over. Direct assessment of light behavior is the best way to set a GRADE on any given diamond. Any other method, such as ray tracing or other predictive tools, may prove highly useful for screening or development of cuts, but is not the way to formulate a final, logical, repeatable and understandable LIGHT BEHAVIOR GRADE.
 

michaelgem

Shiny_Rock
Trade
Joined
Feb 26, 2003
Messages
379
Date: 3/13/2007 1:40:07 PM
Author: oldminer
Seems to me that charts, regardless of how detailed and complex, cannot convey the necessry requirements to GRADE any particular diamond correctly all the time. There are quite a few small details of cut which are not addressed by even the most complex devices which measure facets and features of diamonds. These small measures or features do have an effect on how well a diamond performs and how it ought to be GRADED. David, I agree on all points. I hope by now we are all in agreement on the limitations and caveats on the use of these charts. MDC

Charts are very good for guiding cutters to a reasonable range of financial and light performance expectations. The most accurate charts combined with the best cutters will foster the most positive end results. There is science and art involved in successful diamond cutting. Surely, these charts are useful and will eventually be revised and refined to be even better over time. Do you think it is apparant by now that in their current state the charts are misguiding the cutters and therefore need to be revised and refined "and show all potential AGS 0''s" as Egs1 said? MDC

Although we may be a long way from a consensus on the lighting model, I believe this long thread is proving a point of view I have expressed many times over. Direct assessment of light behavior is the best way to set a GRADE on any given diamond. Any other method, such as ray tracing or other predictive tools, may prove highly useful for screening or development of cuts, but is not the way to formulate a final, logical, repeatable and understandable LIGHT BEHAVIOR GRADE. A quote from my current article in NY Diamonds is in agreement with you.
"Several diamond cutting houses and retailers, some grading laboratories, and some gemologists and researchers including the author, set the bar for the best make higher in some respects than either GIA or AGS. In a sense you could say that they answer to a higher authority. For this investigator, that authority comes from a "direct assessment" (Cowing, 2005) of the diamond''s optical performance in typical illumination circumstances."

Michael Cowing
 

adamasgem

Brilliant_Rock
Joined
May 23, 2003
Messages
1,338
Date: 3/14/2007 9:53:14 AM
Author: michaelgem

Date: 3/13/2007 1:40:07 PM
Author: oldminer
Seems to me that charts, regardless of how detailed and complex, cannot convey the necessry requirements to GRADE any particular diamond correctly all the time. There are quite a few small details of cut which are not addressed by even the most complex devices which measure facets and features of diamonds. These small measures or features do have an effect on how well a diamond performs and how it ought to be GRADED. David, I agree on all points. I hope by now we are all in agreement on the limitations and caveats on the use of these charts. MDC

Charts are very good for guiding cutters to a reasonable range of financial and light performance expectations. The most accurate charts combined with the best cutters will foster the most positive end results. There is science and art involved in successful diamond cutting. Surely, these charts are useful and will eventually be revised and refined to be even better over time. Do you think it is apparant by now that in their current state the charts are misguiding the cutters and therefore need to be revised and refined ''and show all potential AGS 0''s'' as Egs1 said? MDC

Although we may be a long way from a consensus on the lighting model, I believe this long thread is proving a point of view I have expressed many times over. Direct assessment of light behavior is the best way to set a GRADE on any given diamond. Any other method, such as ray tracing or other predictive tools, may prove highly useful for screening or development of cuts, but is not the way to formulate a final, logical, repeatable and understandable LIGHT BEHAVIOR GRADE. A quote from my current article in NY Diamonds is in agreement with you.
''Several diamond cutting houses and retailers, some grading laboratories, and some gemologists and researchers including the author, set the bar for the best make higher in some respects than either GIA or AGS. In a sense you could say that they answer to a higher authority. For this investigator, that authority comes from a ''direct assessment'' (Cowing, 2005) of the diamond''s optical performance in typical illumination circumstances.''

Michael Cowing
Then Michael..
Perhaps you should call on the makers of "direct assesment" devices to release their paradigms, i.e. charts of their grades vs averaged (T,S,CA,UGFP,G,LGFP,LGFL,PA,C), in the same manner you have been pestering AGS, as an aid to cutters and for "your" (and my
41.gif
) intellectual stimulation.

I might even join you there, as right now we know absolutely nothing!
36.gif
 

oldminer

Ideal_Rock
Trade
Joined
Sep 3, 2000
Messages
6,696
The charts, if direct assessors ever make any, will read a lot like AGS charts. There will be exceptions to the measurement conclusions on the charts as there are nuance differences among diamonds that have the same measured factors. The more measures one takes, the more one depends on numerous variables, then the junk the science becomes.

It is a fruitless task to put forth more charts. Direct assessment does not require charts, but one can deduce charts from directly measured results, out of the database, if one wished to give cutters a guide to better cutting. Since the charts from AGS pretty much do that already, it would not be a great benefit to publish basically the same charts over again. What I am saying, and Michael is mostly agreeing with, is that charts won''t and can''t work as well as direct measurement of performance.

I do agree that how a diamond is illuminated is of importance. If qualified human eyes judge the grade provided relates well to the actual quality of the diamond''s appearance, we then have a system which works. Of course, it isn''t just that simple. I am making it simple for explanation only. We can argue over the details of the lighting, but its how the appearance of the diamond correlates to the selected grade which makes it a system that works or fails to work. We think there now is such a system and it is well covered by granted patents. I truly believe it needs some good and open testing by unbiased experts otherwise we can argue forever going nowhere. Thus suits some vested parties, but is a poor course of action for the trade and consumers.
 

adamasgem

Brilliant_Rock
Joined
May 23, 2003
Messages
1,338
Date: 3/14/2007 2:10:16 PM
Author: oldminer
The charts,if direct assessors ever make any, will read a lot like AGS charts. There will be exceptions to the measurement conclusions on the charts as there are nuance differences among diamonds that have the same measured factors.

I guess you have already made these comparisons, if you can make the statement above. I guess that those who already have non contact measurement devices can then use software to get the "grade", and don''t need a direct measurement device and another process, that is, if you give the same "grades" as AGS.


The more measures one takes, the more one depends on numerous variables, then the junk the science becomes.


Are you saying that "one measurement" of one factor, is sufficient to accurately "grade" the diamond under all the light conditions it would be in, and that there are no tradeoffs between factors????

Is that where you are going?


It is a fruitless task to put forth more charts. Direct assessment does not require charts, but one can deduce charts from directly measured results, out of the database, if one wished to give cutters a guide to better cutting. Since the charts from AGS pretty much do that already, it would not be a great benefit to publish basically the same charts over again.

What I am saying, and Michael is mostly agreeing with, is that charts won''t and can''t work as well as direct measurement of performance.

Then why was he (Cowing) clamoring for better charts, or are the "direct measurement" equipment suppliers using (or wanting to use) "more detailed charts" to set or expand their paradigm to fit other thought processes.??

The plot is thickening, some interesting correlations here, IMHO.


illuminated is of importance. Yes, and the relative results will vary between two envirionments..

If qualified human eyes judge the grade provided relates well to the actual quality of the diamond''s appearance, we then have a system which works. (Maybe for one (more than one?) environment) making it simple for explanation only.

We can argue over the details of the lighting, but its how the appearance of the diamond correlates to the selected grade which makes it a system that works or fails to work. We think there now is such a system and it is well covered by granted patents.

One direct measurement can give you a "Grade", just as ray trace analyses can, which is more detailed, or accurate in separating factors with tradeoffs is another thing.

I truly believe it needs some good and open testing by unbiased experts otherwise we can argue forever going nowhere.

That I can''t disagree with..


Thus suits some vested parties, but is a poor course of action for the trade and consumers. Why would it be a poor course of action??? Should the trade and consumers blindly accept "it", whatever "it" is.
 

oldminer

Ideal_Rock
Trade
Joined
Sep 3, 2000
Messages
6,696
Marty;

Your digging questions always amaze me. I thinkt the database collected on many diamonds with differing degrees of performance would offer a version of "charts" for cut development based on real observed diamonds, not theoretical diamonds. Since cutting is an art, charts won''t force a diamond to come out exactly as any chart dictates. There will always be variations in the end result, no matter how one attempts to stick to the commands of the chart.


I am saying that I believe the predictive models are quite close for making judgments based on the factors which are being taken into account, but don''t and can''t be based on every possible nuance of cutting. There are just not enough columns in the spreadsheet for all the possible variables which might or might not be measured. You very well know that adding more varialbes is more than likely to destroy accuracy rather than create it. It is junk science, or so I am told. You are the highly educated one here and I believe you will agree that one can throw variables at problem solving until no solution could possibly work. How every variable effects outcome is not possible to put on a chart. Direct assessment looks at the stone and takes every result of measaured and unmeasured variable into the final grade.

I am NOT saying the measurement of one factor gives a grade. There are many factors of light which are being made to get to the result. What we are not factoring in are proportions, or facet lengths, or angles, etc. We measure them for record keeping but do not use these for predicting light behavior. Light behavior is measured by a field of science going by the name of "imagestatistics".

I can''t tell you why someone lese wants better charts. My old ones tell me enough for most stone screening. However, I think you would want the best information availbel to be provided instead of misleading ionformation, if such is the case. Maybe Michale was unclear on this, but it seems perfectly clear to me that TRUTH is important in the process, not just lots of charts which are less accurate than what might be provided.

The "Grade" of light behavior is made with sa series of measurements, not a single measure, as was first the case. Multiple measures give much more repeatable grading results. Multiple measures allow devices in different locations to give identical grading. This interoperability is a crucial element to grading accuracy. It also will allow labs with branches in different locations to provide identical services.

I hope to do some open testing with cooperating people and labs over the next few months. We''ll see how it goes.
 

adamasgem

Brilliant_Rock
Joined
May 23, 2003
Messages
1,338
Date: 3/15/2007 7:55:52 AM
Author: oldminer
Marty;

Your digging questions always amaze me. I thinkt the database collected on many diamonds with differing degrees of performance would offer a version of ''charts'' for cut development based on real observed diamonds, not theoretical diamonds.
And from that you can get the necessary to paramaterize a "chart", however the quantization (i.e. CA +-0.1 degree vs CA +/- 1.0 degree) requires large number of samples at each point, because of the wide variation in "answers" you would potentially receive at each point, depending on your envirionment. Some envirionments may not be as sensitive to cutting variations as others.


Since cutting is an art, charts won''t force a diamond to come out exactly as any chart dictates. There will always be variations in the end result, no matter how one attempts to stick to the commands of the chart. I agree..


I am saying that I believe the predictive models are quite close for making judgments based on the factors which are being taken into account, but don''t and can''t be based on every possible nuance of cutting. There are just not enough columns in the spreadsheet for all the possible variables which might or might not be measured. That is a problem!!!

You very well know that adding more varialbes is more than likely to destroy accuracy rather than create it. It is junk science, or so I am told. I would say the the general statement you made would indicate that the person who told you that may have had his or her head stuck up his or her backside. You need sufficient varaibles to describe the problem, and enough measurements to solve for the variables.
You can describe a straight line by a slope and intercept and need two measurements, at two points to solve for the variables. (Or you can neglect the intercept and descibe only a slope with one variable)
However, trying to describe a physical problem with one varaible like slope, who response is parabolic or othewise non linear, results in potentially junk answers...


You are the highly educated one here and I believe you will agree that one can throw variables at problem solving until no solution could possibly work.

Just the opposite occurs.. you add variables to adequately describe a process and get the best correlation with the measurements, however the variables must "relate or describe" a "real" process. You can fit curve EXACTLY through n measurement points with n-1 varables, however the next set of measurement points may not be described exactly by the n-1 variables you used initially.

How every variable effects outcome is not possible to put on a chart. Direct assessment looks at the stone and takes every result of measaured and unmeasured variable into the final grade. Not necessarily true, it gives you a result in one envirionment paradigm, so far undefined, which may or may not descibe what is really needed.

I am NOT saying the measurement of one factor gives a grade. There are many factors of light which are being made to get to the result. What we are not factoring in are proportions, or facet lengths, or angles, etc. We measure them for record keeping but do not use these for predicting light behavior. But you could potentially do the correlation.

Light behavior is measured by a field of science going by the name of ''imagestatistics''. As we all know, you can sometimes make statistics say two different things. And you may not have enough information in one "paicture" to adequately describe the problem meeded. You can solve one problem (or grouped problem) with one picture, for that envirionment. As you may have read by now, as previously posted on PS a few years back, you can get descrimination by varying or changing the envirionment, but do you get the answer you need.

I illustrated this in a PS thread, where I showed the weight light return for different stones versus total hemispherical lighting angles of illumination. High angle lighting gives you more descrimination or separation between stones because of efficiency, but is limited high angle lighting the correct tool.

I can''t tell you why someone lese wants better charts. My old ones tell me enough for most stone screening.

However, I think you would want the best information availbel to be provided instead of misleading ionformation, if such is the case. Maybe Michale was unclear on this, but it seems perfectly clear to me that TRUTH is important in the process, not just lots of charts which are less accurate than what might be provided.

I think I made myself clear before on this..
17.gif


The ''Grade'' of light behavior is made with sa series of measurements, not a single measure, as was first the case.

Oh, so paper issued with the "first case" will be different than current paper ? New improved black box analyses
41.gif


Multiple measures give much more repeatable grading results. Multiple measures allow devices in different locations to give identical grading.

Ah, you have proved my point, because it is a multivariate problem, you need more measurements to get correlations, or remove measuremnt noise (another varable).

This interoperability is a crucial element to grading accuracy. It also will allow labs with branches in different locations to provide identical services. Understood, however there will still be noise and uncertainty in the results because of measurement errors. It is like if we used the GIA grading system and the average crown angle was 34.249999999999 one time and 34.250000000001 the next time one time GIA would "say" that the crown angle was "34.0" and the next time it would be "34.5" , and potentially give two different results.. FARCEWARE(TM). That is also the problem with using charts.. How do you smooth through the boundaries.

If AGS issued charts like Michael wanted, they could NOT describe the variation due to assymetries in the real grades unless they turned on a supercomputer and let it run for a while, and then they would need a multivariatiate statistical stone generator, which doesn''t exist, that I know of. Or else they would need a HUMONGOUS database of real stones to gather the data needed, which doesn''t exist at this time.

As I said before, even if AGS has GIA''s database of real stones (which probably doesn''t include the necessary SRN or other type of MESH files) , I don''t think it would be adequate to do what is requested, because of sample size needed.

I hope to do some open testing with cooperating people and labs over the next few months. We''ll see how it goes. It will be interesting to see the results.
17.gif


Dave and I always have had interesting discussions, publically and privately, and I consider him a friend, even though we may disagree, or I have to "correct him" on some public statements.

He knows what he doesn''t know (or thinks he knows) and learns, sometimes the hard way, as we ALL do.
I even make mistakes from time to time, and admit them.
17.gif


oldminer

Ideal_Rock
Trade
Joined
Sep 3, 2000
Messages
6,696
Marty is a master of these highly technical things. I deeply respect and appreciate his continued input to my further education. Constructive advice and legitimate dissent is not a problem, but a true benefit for everyone.
 

adamasgem

Brilliant_Rock
Joined
May 23, 2003
Messages
1,338
Date: 3/15/2007 3:19:16 PM
Author: oldminer
Marty is a master of these highly technical things. I deeply respect and appreciate his continued input to my further education. Constructive advice and legitimate dissent is not a problem, but a true benefit for everyone.
Thank you Dave..
 
Status
Not open for further replies. Please create a new topic or request for this thread to be opened.
Be a part of the community Get 3 HCA Results
Top