shape
carat
color
clarity

HCA Questions

Status
Not open for further replies. Please create a new topic or request for this thread to be opened.

lostdog

Shiny_Rock
Joined
Dec 14, 2004
Messages
179
Okay, I am trying to understand HCA...

The gist is that what matters more than an individual measurement is the performance of the combination of certain measurments. HCA reduces this to pavilion and crown angle organized by table %. Logic being light goes through the crown, reflects/refracts off pavilion and returns to exit through the crown, star, table, and girdle facets. (okay, it''s not that simple, but anyway...)

I think I have that right, but I hope anybody can correct as needed.

So,

The HCA rating actually works by taking the measurment of the diamond as input and comparing them to the pavilion by crown by table set of data points (2197 points = 13x13x13).

Crown angles are in 1 degree steps and Pavilions in 0.5 degree steps (grouped in 1 degree table increments).

Then for a given table, there are 169 points on the grid (13x13).

The 169 points are the result of subjective analysis of virtual models of the 169 angle combinations, each rendered in several different lighting conditions.

The HCA screen shows a contour plot of the overall scores, which suggests something continuous. My question (for now) has to do with how an individual score is generated. Looking at the scores over a given range, the scores between any of the two data points come from a simple linear interpolation, is that right? Or is there a spline sort of a surface involved?

Which leads into the question of how neighboring points impact a score...

My concern here is looking at diamonds which are not in the solid middle of the red area. There are some places where very small variations in angles make huge differences in HCA scores

On http://www.diamond-cut.com.au/25_accuracy.htm the following is mentioned: "A ±0.2 degree variation in angle data can give rise to as much as 0.6 variations in HCA score in some critical cases, or as little as 0.1 in less critical zones. "

But I can find even greater sensitivity to the angles. +/- .1 degree shifting HCA up a whole point. Try 55% table with 34.9 crown angle and sizes around 41. 40.5 is obviously great, but 40.9 is still 1.7 HCA while 41.1 is 2.7 HCA.

My impression is that some of these highly sensitive spots on the chart (between the dark red and the thinnest part of the green band) may not represent the true performance of the stones. Is .2 degrees here going to knock off the beauty of the stone to the extent the difference in HCA scores suggest?

Which is why I ask about the scoring calculation. The local scoring of the 40.9 is interpolated from the evaluation of the 40.5 stone and the 41.0 stone, and the 41.1 stone is dependant on the 41.0 and the 41.5 scores?

Since this represents a big jump in the value of the stone, and suggests a major difference in their performance, would it make sense to have more data points in these rapid transition areas?

I know one good defense of the HCA system is that it allows you to reject stones, and that it''s safer to stay away from the edges of cliffs and all that. But there are sometimes stones that otherwise look very good in all measured respects, and then they stray from the mainstream area of HCA and raise doubts. So it''s comforting to wait until you have a stone you can''t chip away at with HCA, so to speak, but assuming I don''t have plenty of ideal cut stones to compare in my given price range, color preference, clarity tolerance, it''s not easy to see what is the case in real versus modeled reality.

I don''t feel I have to have some specific HCA to get a top quality stone, but I would like to think I am not passing up something really good to spend $$$ more on a tenth of a degree, maybe two.

- - - - -

BTW, this is my first post. Thanks for all the great info you guys/gals have managed to gather here. It also seems like you''ve been having quite a good time!
 

diablo

Rough_Rock
Joined
Dec 7, 2004
Messages
13
I was looking at the coloured HCA chart earlier and wondering the same thing about sensitive spots on the chart. e.g. the diamond I am buying has pavilion angle of 40.9 which sccore 1.3 on HCA but is at a point on the chart where the colours change rapidly with small changes in angle. Maybe it''s last minute nerves about such a big purchase.
32.gif
I will finally get to see the diamond tomorrow.
 

Garry H (Cut Nut)

Super_Ideal_Rock
Trade
Joined
Aug 15, 2000
Messages
18,484
Excellent observations LD.

2 things to consider.
1. Diamonds that are knocked down because they are too shallow - this is because an observers head obscures light sources. A diamond with say 40 degree pavilion and 33 crown reflects a ray entering the table main directly back paralel to the same point via the crown facet. (the minor facets can still get some light from 12 degrees either side of you noggin). But this process is quite gradual - hence I am not too hard on this - the most shallow diamond looks great from 2 meters. But at 6 inches for an 18 year old girl - a diamond with C34 P40.5 looks like crap.

2. The relationship between leakage is caused by the critical angle - as this relates to 2 reflections off the pavilion - the physics is more critical. Now I have just had a lovely Salmon BBQ here in Melbourne Aussie land, and the better 1/2 of a nice bottle of wine. If I need to explain that in more detail - ask me tomorrow. But me thinks you have an excellent grasp of the physics and can probably explain it better than moi.

But thanks for the stimulating and well researched question.
 

valeria101

Super_Ideal_Rock
Premium
Joined
Aug 29, 2003
Messages
15,808
Date: 12/16/2004 4:389 AM
Author:lostdog

But I can find even greater sensitivity to the angles. +/- .1 degree shifting HCA up a whole point

Some time ago I gave myself an answer to the same Q. Maybe it rings true with you as well, or at least I can learn more myself
1.gif

The HCA chart shows indeed an aparent tradeoff between crown and pavilion angles. "Tradeoff" means a liners relationship... basically. Somehow the makers complicated the relation into something more intricate than linear.


Indeed, how could someone pretend to make a liner function sound autoritative ? Just think of how easy is that to attack!

11.gif
So the chart looks intricate for it''s own good
12.gif
To me, those color splotches on the chart, suggest that an empiric observation were at some point incorporated - there is some noise making things look interesting
2.gif
Goo for them.


All in all, even if the basic idea of the HCA is a tradeoff, the darn score does not come from a liner function. Indeed, coming as a combination of four metrics (you know, brilliance, scintillation, spread, fire...) the result cannot be linear lest strict conditions are met.


Non linearity gives jumps that appear less than intelectually attractive, as you say.


It is relatively hard to build composite metrics. As far as my experience goes, there is always some point where everyone on the project gets sick and tired with the analitics and agrees with the "executive decission" to put the results out there and wait for feedback ! Not sure if a better solution exists without getting into really exotic methods.


I have not checked to see how senzitive is the HCA on small neghbourhoods thoughout the carts range. Since they say "take HCA=2 or less for granted" - jumps of more than 1 point would make this statement debatable.
It''s not easy (for me at least) to decide what is a significant jump: for once, there is the limited precission of the cutting process. If a cutter cannot twak less than 0.2 of a degree for any given facet - is it practical to look at greter precission ? And then, the measurements come with some more variatiuon on top of that. Remember those threads with GIA versus Sarin measures? AGS graded stones do ot go back to Sarin at all, but why assume AGS has better metrics ?

So... that "take HCA <2 or leave it" sounds reasonable. If not by precise math, then by common sense - that score cannot be any better than the numbers that get into it. And those are not perfect.

If there is some better sensitivity analysis than this behind the HCA, I''d love to take a peek as well
1.gif


Garry H (Cut Nut)

Super_Ideal_Rock
Trade
Joined
Aug 15, 2000
Messages
18,484
I have also been a little hard because of this.
My Ideal-scope analysis was overly sensitive to leakage. I am now not quite so harsh - if i did the empirical stuff again the big jump would be a little more gradual - but not a lot more.

sergey 111211.jpg
 

lostdog

Shiny_Rock
Joined
Dec 14, 2004
Messages
179

Garry, thanks very much for your reply. I think you have done a great thing to build your system, and, just as importantly, you have made it easily available for all. (And if I am making comments about one aspect or another, it is because I see how valuable HCA is as a tool). I especially appreciate the chance to discuss it with you.

I figure you know most of what I have written below, but I am going to try to go though his carefully so that others can follow my thinking (or not as may be the case).


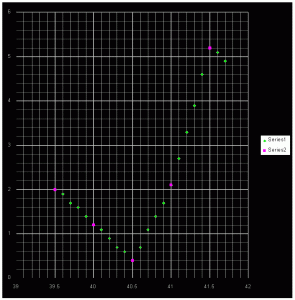
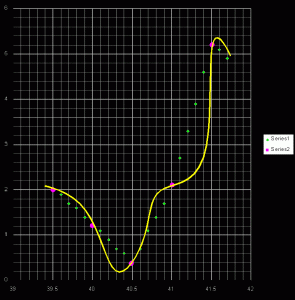
As for linear, here’s what I was saying. The graph below is for 55% table, 34.9 Crown. Pavailion angle is the horizontal and HCA score is the Vertical.

The magenta points are the empirical data points, based on observation of the various models. The green points are the HCA scores for pavilion angles in between the half-degree steps that were modeled. If you drew a line between the pink data points, the green points are right on it, give-or-take what is probably rounding the HCA to nearest 0.1.

349c-1.GIF
 

lostdog

Shiny_Rock
Joined
Dec 14, 2004
Messages
179

Look at each set of four green dots. You can see how the line they form changes angle from set to set.


There’s an inflection point, a minimum at 40.5. Okay, makes sense. There’s also a maximum at 41.5. Possibly this means that further increase in P redeems the stone (for reasons that can be discussed. In the Russian studies as well as the HCA contours there is an upper right island or peninsula where various performance numbers improve). However, crown angles over 41.7 generate an error message, so I couldn’t plot them. It would be interesting to see what 42C comes back as.


My concern isn’t that a linear interpolation is bad. The potential change in score is not all that significant. Look at a couple variations below:
 

lostdog

Shiny_Rock
Joined
Dec 14, 2004
Messages
179
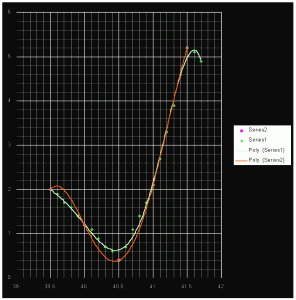
plot 2:

349c-2.GIF
 

lostdog

Shiny_Rock
Joined
Dec 14, 2004
Messages
179

The green line is a mathematical curve fit to the full set of points while the orange line is a mathematical curve fit to just the data points. This method assumes in both cases that there is some continuous relationship between the P angle and the HCA score, which is probably not the case (in other words the performance at 39.5 affects the performance at 40.5, which isn’t really true. There’s a relationship, but they are not “linked” so much as they are just nearby each other.) The orange curve is actually calculated here in a way that exaggerates the differences from the green interpolated points. Though, it still might be a hint as to why very small differences in HCA score should not trump all other factors.


The left peak on the orange line is a result of cutting off the date at that point, and is misleading. The right peak on the green line is based on actual change in HCA score. It’s also misleading in that it should include the 5.2 peak that is an actual data point.


So what does this prove? Well, my guess is that actual performance of the diamonds is actually something in between both of these situations. (Not literally in between the lines, but conceptually the real behavior has elements of both approaches). It doesn’t change direction suddenly at any one point, though it does change direction.


My real interest is how and where it drops off.


I can find a number of good diamonds, really well cut, branded super-ideal cuts right at 40.9P in the 34.9C area. I won’t name vendors for now, but regular pricescope readers would have no worries these are excellent diamonds based on the sources. And some are 41.0P and some are 41.1P.


Pavilion angles given by Sarin for these are sometimes listed with a +/- 0.1 degree range. Occasionally it’s a +/- 0.2 degree range. One in a while a tenth more than that. ( I assume that the range listed is the actual range of all the measured facets, not a tolerance ).


So some 40.9 nominal stones have angles up to 42.2, often 41.1. (Sarin itself according to info elsewhere on this forum is +/- .2, though some of that is a function of operator skill and calibration.)


As a result, the ratings of a lot of these stones is turning on the finest hairsplitting. One facet or two off by one tenth of a degree moves the averaged number reported as “Pavilion Angle” and as a result the HCA moves (would move) a lot.

It moves so far because the data point at 41.0 is where it is and because the data point at 41.5 is where it is. Fair enough, that’s the concept driving the system and it represents sound logic.

But two things keep me up at night about this.


One is that we don’t know what the profile of the plot above really should be. A computed curve can be distorted by a falsely introduced relationship between the points. A straight interpolation is smart in that it doesn’t introduce new errors (well, it minimizes them), but it assumes the performance heads from directly from data point to data point, which we don’t know to be true either.


So I there is this obvious difficulty with the 40.9 to 41.1 transition since the resolution of empirical data is somewhat coarse given how quickly the performance is changing in this region.

The branded super-ideals for example, are a lot less common above 41.0 degrees, but then the target market for the branded stones is those consumers aware of HCA’s importance, so HCA 2 would find a much smaller market. So it’s easy to see HCA is guiding cutting and marketing decisions, because it’s guiding buying decisions.

The “real” curve might change a lot more or less rapidly in some places. Which means some stones that HCA interpolates to one score might actually be performing substantially better than that. That doesn’t mean that 34.9C stones are HCAp]
So one question I have is whether you feel real live actual 35.0P or 34.9P AGS0 stones you have seen fall apart at that range, 41.0 and the increments beyond?

(Actually, I’ve got more to ask here, including replies to points brought up by Garry and other posters above, but I am really slow at thinking this through. I apologize for the length.)


Serg

Ideal_Rock
Trade
Joined
Mar 21, 2002
Messages
2,631
Date: 12/17/2004 5
6.gif
8:47 AM
Author: lostdog

Garry, thanks very much for your reply. I think you have done a great thing to build your system, and, just as importantly, you have made it easily available for all. (And if I am making comments about one aspect or another, it is because I see how valuable HCA is as a tool). I especially appreciate the chance to discuss it with you.

I figure you know most of what I have written below, but I am going to try to go though his carefully so that others can follow my thinking (or not as may be the case).


As for linear, here’s what I was saying. The graph below is for 55% table, 34.9 Crown. Pavailion angle is the horizontal and HCA score is the Vertical.

The magenta points are the empirical data points, based on observation of the various models. The green points are the HCA scores for pavilion angles in between the half-degree steps that were modeled. If you drew a line between the pink data points, the green points are right on it, give-or-take what is probably rounding the HCA to nearest 0.1.

Hi,

Re:The magenta points are the empirical data points, based on observation of the various models

Could you clarify this your statement? How did you receive empirical data points? What is difference between "empirical " ( magenta points) and theoretical ( green points) dates?
 

lostdog

Shiny_Rock
Joined
Dec 14, 2004
Messages
179
The magenta points are the actual crown/pavilion angle combinations that were modeled and reviewed by experienced diamond grading eyes to come up with HCA scores.

The green points are are crown/pavilion angle combinations that are approximated based on the nearest magenta points.
 

lostdog

Shiny_Rock
Joined
Dec 14, 2004
Messages
179

Here’s the follow-on:


The “magenta points”, the places where the virtual diamonds were evaluated, let’s take as a given. It’s subjective, you can debate a score here and there, but diamond beauty is subjective, and strength of HCA is that it combines both what can be seen and what can be measured.


The first model for connecting the magenta dots is interpolation or drawing lines straight lines between them.


The second model for connecting them is to just generalize the smoothest line possible that includes all the magenta dots.


Both of these are not inconsistent with what was observed and evaluated only to the degree the score at any one magenta point is the same in both models. These solution incorporate the existing data and make assumptions abut the missing data. The drawback to the second model is that methods which smooth lines across multiple points often extend the influence of the behavior of one region based on the performance of another region. In the case of a diamond, just because there is poor performance say 1 degree higher, that effect really may have little to do with performance 1 degree lower. So you can’t just draw a pretty line and assume it means anything.


Part of the issue is that not only are the interactions between light and geometry variously changing, but we are actually trying to incorporate multiple criteria (fire, scint, brilliance, for starters) all of which may be moving in different directions as geometry varies, and I for one don’t know how suddenly they are going to go up or down as paths inside the stone are approaching a critical angle (and upon total internal reflection, where is the light going instead?)).


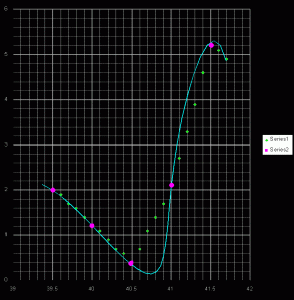
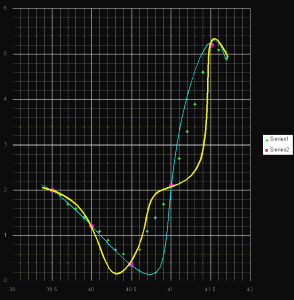
For example, following are two more curves that also fit the “magenta points”. This means that they could also represent the true performance of the diamond as the pavilion angle is changing. (Not that they do, they are chosen to illustrate two extremes that also incorporate the exisiting data. They are mathematical curves anchored by I think 7 points total (as opposed to just drawn freehand)).


The points as the same as in the earlier plots. First each curve is shown separately, and then the two are overlaid (one of the yellows is slightly shifted because I had to recreate it in a hurry, but you get the concept I hope) :

Again, look more at the behavior between 40.5 and 41.5 than anything, as the rapid transition has the most opportunity to vary.
 

lostdog

Shiny_Rock
Joined
Dec 14, 2004
Messages
179
Blue line: (HCA score is vertical axis, pavilion angle is horizontal axis, crown agnle is 34.9, table 55%, all same as previous plots)

blue-1.GIF
 

lostdog

Shiny_Rock
Joined
Dec 14, 2004
Messages
179
Yellow line: (same parameters)

yellow-1.GIF
 

lostdog

Shiny_Rock
Joined
Dec 14, 2004
Messages
179
The two lines overlaid for comparison:

blueyellow-1.GIF
 

lostdog

Shiny_Rock
Joined
Dec 14, 2004
Messages
179

A difficulty here is that with only those “hard” magenta data points, it’s mostly just supposition as to what’s going on in the intermediate values. This is not a big factor from 39.5 to 40.5 as it’s not going to stray too far and whether HCA is 1.7 or 1.3 isn’t critical.

Though it is interesting to think about where the minimum might actually be occurring, above or below 40.5.


It’s more interesting at 40.5 to 41.0 and slightly beyond. Performance under 41.0 might be off a little, (improving tremendously if it was anything like the blue line above), but above it there’s great room for variation before ending up at 41.5/5.2.


One issue is that we are comparing diamonds by tenths of degrees based on observations taken at halves. Essentially having more “hard” data points in these areas would diminish the problem of interpolating or otherwise connecting the dots. But if one were to model and sample by tenths, instead of 13x13=169 diamonds to evaluate for each table size, it would be 61x61=3,721 stones per table. Or 48,000 stones instead of the 2,197 used in making HCA and the system would be up and running in about 50 years. So it’s not as if all the points can be individually evaluated.


But I am curious as to whether it makes sense to try to learn more about the way these transitions work.


Another way would be run calcs on the series at 34.9C from 40.5P to 41.5P for each tenth and just seen where some of the numerical values end up. Those might be hints as to where the curves should be weighted, though nothing directly about those HCA scores.


I suppose the virtual idealscope image could also be reviewed to see where performance accelerates or hits the wall. (Looking with the GemReader at the downloadable files (for crown 34.8’s), the 41.0 pavilion has a much pinker table than the real life idealscope pics it seemed to me, but this is a whole separate issue.)


Both of these are really just looking to see what the curve might look like. More involved method would try to replicate the original conditions and methods that produced the empirical points and see how the range looks when scored individually in smaller steps.


- - - -

It’s been suggested to show the entire range up to 43, which I’ll do, but need to run on slightly different depth to keep it consistent.
 

TLS

Shiny_Rock
Joined
Sep 8, 2004
Messages
241
ok, here is where I start to panic.

My new ideal diamond has a pavilion angle of 40.9. I was actually thinking about this same issue last night and wondering how accurate those sarin machines are.

Are you saying that it is possible for them to be off by a couple degrees - this is common? I am thinking here that the vendor I worked with would see a visual difference in the stone if that was the case for me.... but this certainly gets me feeling very paranoid.
 

Rhino

Ideal_Rock
Trade
Joined
Mar 28, 2001
Messages
6,340
This can get further complicated because the HCA assumes *all 8 pavilion angles* are of the same degree and while I have seen some very precisely cut diamonds, never have I seen one where all 8 angles are identical. In general it''s not a problem but if you are looking at a diamond with 40.9 or more particular 41 degrees it is possible that 4 or more of those pavilion angles are actually greater than 41 degrees while the others fall shy of it. Those angles that do fall greater than 41 *could* turn out to be a problem with light leakage ... what is most important is the crown angles that are coupled with those particular pavilion angles.

41 degrees is a threshold angle, which in most ideal cut diamonds (particularly those with 34.x degree crown angles and greater) contribute to a little too much leakage under the table. More than Gary and I care to see.

I have seen diamonds with 41 degree pavilion angles that were absolutely stunning and tested out to be so and I''ve seen those that fall on the other side of the fence. Those stones in particular usually had more than a few of those pavilion angles falling greater than 41 degrees. This is why it is good to now only know the Sarin dimensions of a given diamond but also it''s variances to see how tight or how loosely the stone was cut.

Another threshold angle, not accounted for on HCA is the pavilion angle of 40.6. Pavilion angles of 40.6 and shallower, when coupled with many ideal crown angles (particularly under 35 degrees) produce a little too much head obstruction in diffuse light conditions giving the stone a *dark* appearance. Gary touched on this but it is something I particularly look out for when hunting down the cherries. Hope this helps.
 

TLS

Shiny_Rock
Joined
Sep 8, 2004
Messages
241
would a diamond score well on the brilliancescope and Isee2 if most angles fell at 41?

thanks
 

asblackrock

Shiny_Rock
Joined
Oct 16, 2004
Messages
201
Hi Rhino
You wrote above:
Another threshold angle, not accounted for on HCA is the pavilion angle of 40.6.  Pavilion angles of 40.6 and shallower, when coupled with many ideal crown angles (particularly under 35 degrees) produce a little too much head obstruction in diffuse light conditions giving the stone a *dark* appearance.  Gary touched on this but it is something I particularly look out for when hunting down the cherries.   Hope this helps.

Could you please tell me at what viewing distance and angle is this dark appearance apparent? (ie is it only close with your head directly over the stone?). I have always been puzzled why so many "super ideal cuts" have pav angles of 40.7 or 40.8 even though HCA scores better for 40.5 and your comment would explain this.
 
Status
Not open for further replies. Please create a new topic or request for this thread to be opened.
Be a part of the community Get 3 HCA Results
Top