Lurky McLurks
Rough_Rock
- Joined
- Aug 20, 2008
- Messages
- 5
Hi Experts,
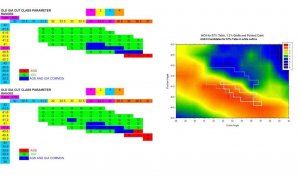
I have noticed a discrepancy in the HCA chart that shows the outline of the potential AGS 0 Ideal diamonds compared to the tabular chart found in the FAQ pages alleged showing the same thing. I''ve attached both charts below. My diamond has the following characteristics.
Depth %: 60.6
Table %: 57
Crown Angle: 34.5
Pavilion Angle: 40.6
According to the HCA, the diamond scores a 0.7, and falls within the AGS 0 Ideal and the GIA Excellent. However, according to the chart on the FAQs page, the diamond does not fall within the AGS 0. Thoughts? Gary? JohnQuixote? Thanks for the advice and help!
(I''m leaning toward trusting the HCA chart over the tabular chart, as the depth % is taken into account, but I just don''t know...).


300x240.png)