shape
carat
color
clarity

Harding ASET similarity

Status
Not open for further replies. Please create a new topic or request for this thread to be opened.

Garry H (Cut Nut)

Super_Ideal_Rock
Trade
Joined
Aug 15, 2000
Messages
19,149
Thanks Gary,
You, AGS and Bruce gave me good idea.
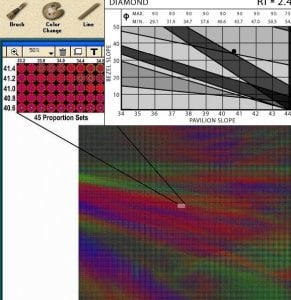
We can code LR, Contrast, BlacZone by color and print on one page .( In future we can do it for B, F, S too)
 
Garry:
It took a lot of perception to see a resemblance between AGS'' ASET diagram and mine.
Actually, it looks more like MSU''s Fig. 1 (macroanalysis of light return nLR_30) in their first report of 1999(?), which is also at the same website; I recognize the AGS green fork from upper left as the MSU red one.
Note that the coordinate axes are reversed - AGS and MSU have pavilion vertical, whereas I had it horizontal. Both had a general trend from upper left to lower right (dexter bend) but to compare details meaningfully, it is necessary to reverse the axes of one of them.
I did this in DiamondTalk, circa 2001, and showed close correlation to this fork, except that the pavilion coordinates differed by about 1°. That is when Yuri Shelementiev pointed-out that this shift was due to the fact that, with 80% deep halves, the halves dominate pavilion reflection, rather than the mains, on which my chart was based. Subsequently I made this shift and the correlation was almost exact, whereby the principles described in "Faceting Limits" explained it.
 
Date: 1/28/2006 2:04:40 AM
Author: Serg
Thanks Gary,
You, AGS and Bruce gave me good idea.
We can code LR, Contrast, BlacZone by color and print on one page .( In future we can do it for B, F, S too)
I get what you are suggesting Sergey
36.gif
36.gif
36.gif
 
Date: 1/28/2006 7:13:54 AM
Author: beryl
Garry:
It took a lot of perception to see a resemblance between AGS'' ASET diagram and mine.
Actually, it looks more like MSU''s Fig. 1 (macroanalysis of light return nLR_30) in their first report of 1999(?), which is also at the same website; I recognize the AGS green fork from upper left as the MSU red one.
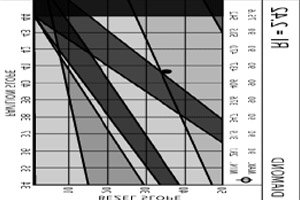
Note that the coordinate axes are reversed - AGS and MSU have pavilion vertical, whereas I had it horizontal. Both had a general trend from upper left to lower right (dexter bend) but to compare details meaningfully, it is necessary to reverse the axes of one of them.
I did this in DiamondTalk, circa 2001, and showed close correlation to this fork, except that the pavilion coordinates differed by about 1°. That is when Yuri Shelementiev pointed-out that this shift was due to the fact that, with 80% deep halves, the halves dominate pavilion reflection, rather than the mains, on which my chart was based. Subsequently I made this shift and the correlation was almost exact, whereby the principles described in ''Faceting Limits'' explained it.
This is the link to the other chart that Beryl refers to I believe
http://www.gemology.ru/cut/english/podrobno_1.htm
 
Also note that Beryl''s chart has the axes the other way round - but the diagonal lines still run more or less the same ways.

sorry about the quick and dirty job

up the other way round.jpg
 
Status
Not open for further replies. Please create a new topic or request for this thread to be opened.
GET 3 FREE HCA RESULTS JOIN THE FORUM. ASK FOR HELP
Top