
How Are Diamonds Made? Natural vs Lab-Created Explained
Two Paths, One Diamond Not all diamonds come from the same place — but they all start the same way. Pure carbon, crystalized under immense pressure and heat. Whether it…
From Faceting Limits: The pavilion and bezel slopes commonly recommended for faceting are the result of trial-and-error and human judgment. This explains why references differ in their recommendations.
Trial-and-error is an effective way to solve complex problems until a better way comes along, but it usually finds only the best solution in the range of experimentation. Other good solutions may exist – beyond the bad ones – but are found only by accident. This has been as true in faceting as in many other scientific fields.
Stones of different RI must be cut with different facet slopes for best appearance. Diamond cutters don’t realize this because they work with only one material, whose RI is 2.42. Colored stone RI’s vary from 1.5 to 2.3.
The best slopes for all stones evolved over centuries. Some colored stone cutters have sensed a relationship between RI and ‘best’ pavilion slopes. Fig.1 shows a plot of traditional slopes vs. RI. If we ignore RI=1.6-1.7 there is an apparent trend, implying that there may be a technical reason for it.
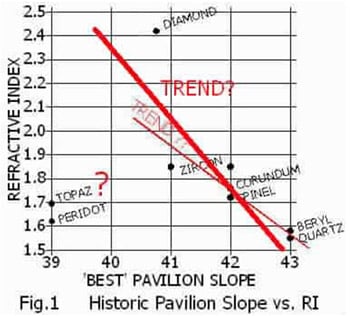
But what about 1.6-1.7? Andrychuk noticed this and commented on it but eventually ignored it. The author thought that there might be two or more ranges for each material but that only one had been found and used by the cutters.
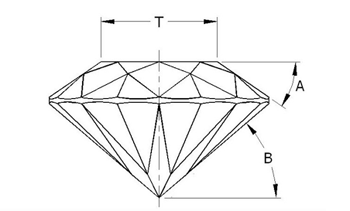
The explanation came when it was noticed that sometimes the viewer sees a reflection of himself. Fig.2 shows that if a ray is reflected more than 10° by the gem the viewer will see it, but if the gem reflects rays at less than 10° he will see himself instead.
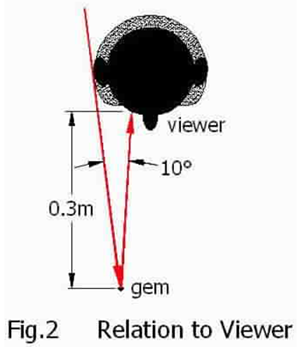
Figure 3 shows how this happens with rays which enter and exit through the table. In this case only the pavilion slope is a factor. Note that the entry and exit rays can diverge (left) or cross above the gem (right); at the normal viewing distance shown in Fig.2 this is not apparent to the viewer.
Considering only the case on the left in Fig.3, the pavilion slope must be less than 44° for all stones (less than 43.4° for quartz).
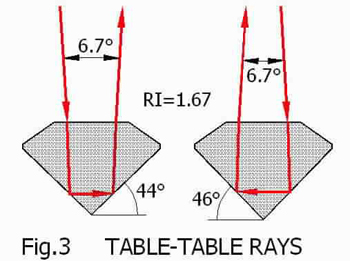
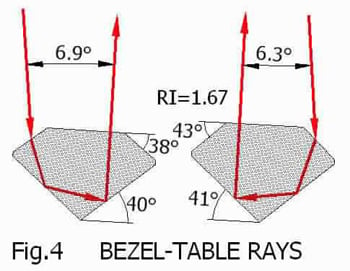
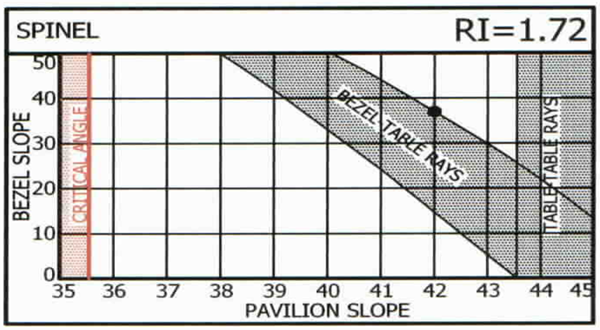
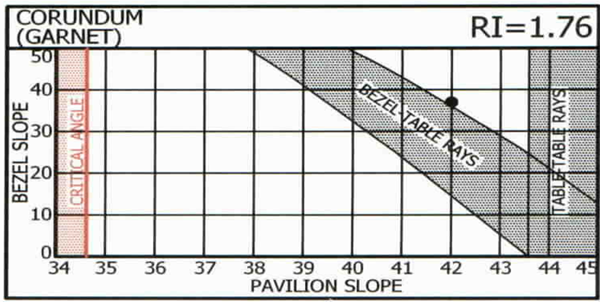
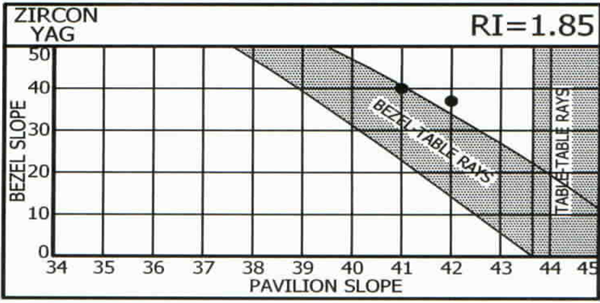
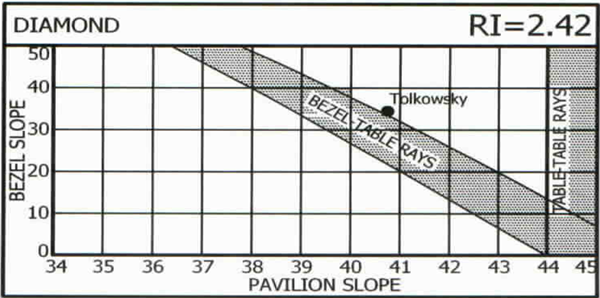
Fig.4 shows how this happens with rays which enter the bezel and leave the table (or vice-versa). Bezel slope is also a factor here, which means that the best pavilion slope depends not only on RI but also on bezel slope.
The next section shows charts of pavilion and bezel slopes, for each common RI., indicating which combinations of pavilion and bezel slopes bend a ray less than 10° and should be avoided. Historic ‘best’ combinations are also shown.
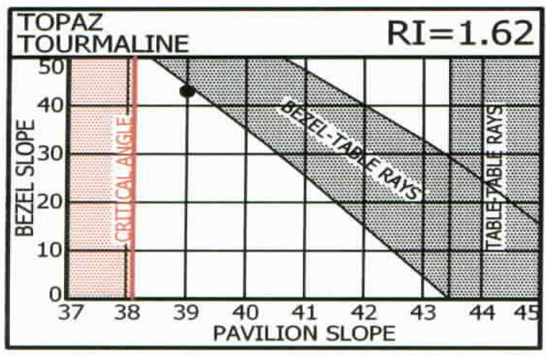
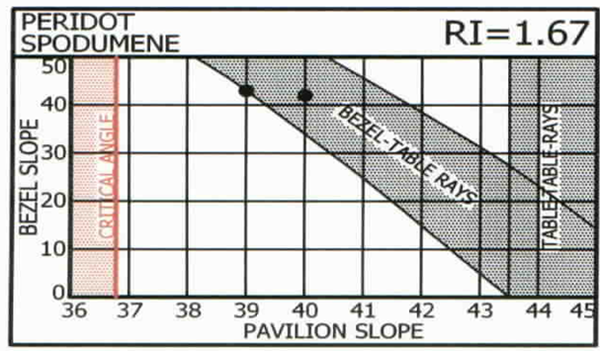
The four charts below have special interest. In each case the historic ‘best’ combination (black dot) is on the upper edge of the shaded diagonal zone which represents bezel-to-table rays with the viewer seeing himself. Such an obvious similarity must have a reason; none was found until Garry Holloway, of Australia, suggested one in 2000: the viewer sees himself in the pavilion main facets but not in the breaks (‘halves’ to diamond cutters) – thus seeing contrast of light and dark between these facets and on-off light and darkness of these facets as the stone, light source, or viewer moves.
It is agreed that contrast is more noticeable to the eye and makes a stone appear more brilliant. The dynamic on-off contrast due to motion is also eye-catching and is commonly called ‘scintillation’.
Thus the historic preferences are due to human perception. No measurement by instruments or statistical manipulation of data will provide this insight.
Why not more than one combination of pavilion and bezel facet slopes along this boundary? Indeed such combinations provide good-looking stones; this has been confirmed by subsequent extensive 3D studies by computers, the results of which are shown in the next segment.
Charts for the higher-RI gems
What about the recommended pavilion slopes for topaz, tourmaline, peridot and spodumene that do not fit the ‘trend’? Look again and you will see that they follow the same logic, but they are adjacent to the OTHER side of the head-obstruction zone.
Apparently some early cutters found good results here, which got worse if they deviated, so they stayed here – just like settlers finding their way into adjacent valleys and never knowing about the others because of the mountains in-between!
Cutting on this side can offer advantages for re-cutting or utilizing odd-shaped rough.
Charts for RI 1.6-1.7
General
Various groups have performed 3D studies and/or produced related charts showing their analysis of ‘best’ cuts in diamond. The significant thing is that they all agree in general. ”Faceting Limits” was just a 2D study of only main facets.
Moscow State University (MSU)
The first meaningful 3-dimensional study was by Moscow State University (MSU). Their study used a colored ‘topographic map’ to indicate relative brightness and fire. Here we show their chart which combines brightness and fire, with yellow as best. The red is AGS’ old proportion-grading standards; its faults are obvious.
On this I superimposed a ‘best straight line’ through the yellow spots, a line representing the brightest in GIA’s first study, and the line of 10° head obstruction (MSU included this factor).
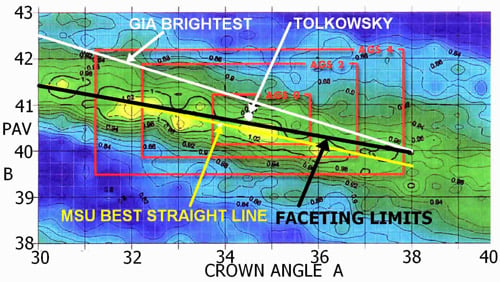
MSU Fig.8a = combined brightness and fire for 53% table
GIA
GIA’s first study was about brightness (light return). It ignored obstruction by the viewer’s head but the line shown here to represent their ‘brightest’ is beyond the range of meaningful head obstruction and so the omission had no effect.
Their study on ‘fire’ had two ‘best lines’ – one along the upper boundary of the head-obstruction zone and the other along the lower boundary; this is curious and of possible interest to someone.
Holloway’s ‘HCA’ System
Garry Holloway created a numerical proportion-grading system based on MSU data and additional factors of his own. This old chart shows his ‘best line’ interpretations and one by Paulsen which extended Tolkowsky’s work. I added the FL line.
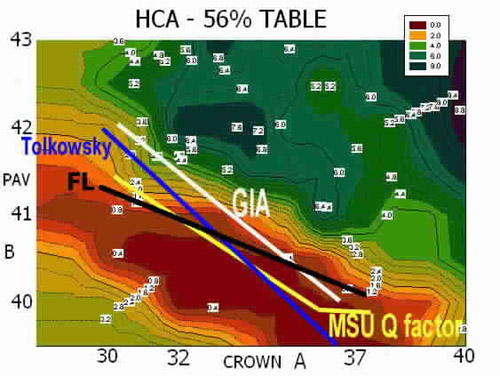
Garry Holloway’s chart for rating slope proportions
Revised AGS Standard
Here is the latest AGS grading system in Spring 2005, upon which I superimposed the other lines
Note tiny areas with a different grade than their neighbors. This is unrealistic: who can cut – or measure – with such precision to change a grade?
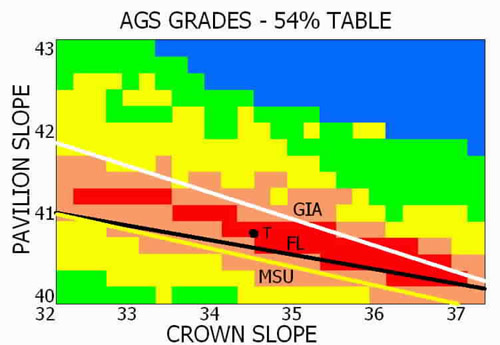
Latest AGS proportion-grading standards
by Bruce L.Harding, March 2005; presented at Antwerp
References
1. GIA Colored Stone Course (1975)
2. Soukup, E.J. (1962) Facet Cutter’s Handbook

Retail Diamond Prices Chart Updated Monthly.
Two Paths, One Diamond Not all diamonds come from the same place — but they all start the same way. Pure carbon, crystalized under immense pressure and heat. Whether it…

A Wedding Ring as Unique as Your Love Finding the right wedding ring isn’t just about diamonds or gold – it’s about finding the one that feels right. With hundreds…
So, you’re thinking about lab-grown diamonds? Smart move. They’re just as sparkly as the natural kind but usually cost less. But where do you actually go to buy them? It…
 is an easy tool that analyzes the data of round diamonds and calculates a score that grades cut quality.")