
The Ultimate Guide to Men’s Wedding Bands: Metals, Fit & Finish
Picking out a men’s wedding band can feel like a big deal, right? There are so many choices out there, it’s easy to get a little lost. But don’t worry,…
Background
GIA began a computer ray tracing Cut Study in 1989. In 2001 they were ready to validate computer findings with a human observation survey. But there was only a 58% correlation.
Is this where it seems they went wrong?
It is also possible the GIA’s computer ray tracing was not up to the task (as many experts suggest) or the results would have reduced the Labs revenue (as some critics suggest, although Lab profits support GIA’s other worthwhile research).
Table 1. Diamonds used in this review
| Specimen | A. | B. | C. |
| Carat/Color/Clarity | 1.16 G SI1 | 1.19 G VS2 | 1.28 G VS1 |
| Diameter | 6.85mm | 6.75mm | 6.92mm |
| Table / depth % | 60% / 58.9% | 55% / 62.7% | 57% / 62.9% |
| Crown Angle | 33° | 34.5° | 35° |
| Pavilion Angle | 40.6° | 41° | 41.4° |
| Girdle[i] | medium to slightly-thick | medium to slightly-thick | medium to slightly-thick |
| Star / Lower Girdle % | 50% / 80% | 45% / 80% | 45% / 80% |
| GIA Cut Grade | Very Good | Excellent | Excellent |
| AGS Light Performance | 3 | 0 (Ideal) | 2 |
| DiamCalc Light Return | .96 | .99 | .88 |
| DiamCalc Contrast | .93 | .99 | 1.01 |
| DiamCalc Spread | +3% | -3% | -5% |
| All stones were graded by GIA: Very good or Excellent for Symmetry and Polish. None for Fluorescence.
Stone A has Painted Upper Girdle Facets |
|||
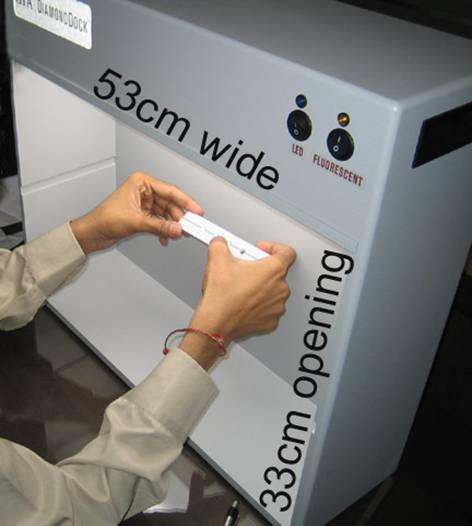
Figure 1. A young grade using GIA’s Diamond Dock lighting box. The tray is actually the same shade as the body of the box, but appears lighter because of its proximity to the two 15 watt high color temperature florescent tubes. There are two switches on the upper right for these tubes and / or 12 LED lights (which are not turned on, also this photo was taken with flash).
[*] – All three diamonds were graded and certified by GIA. The report numbers have not been given to protect the anonymity of the companies who made these diamonds available for this study.
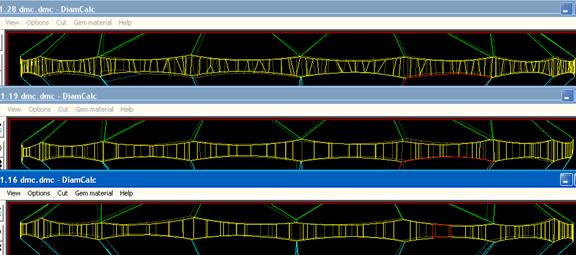
[i] – The girdle profiles shown here for all three Medium to Slightly-Thick graded stones. There is very little difference, especially between A – 1.16 and C – 1.28ct stones. Note that C has slightly painted upper girdle facets which adds to the ‘shallowness’ of this stone by reducing the contrast and lowering the upper girdle facet angles by around one degree.
| (A) | (B) | (C) |
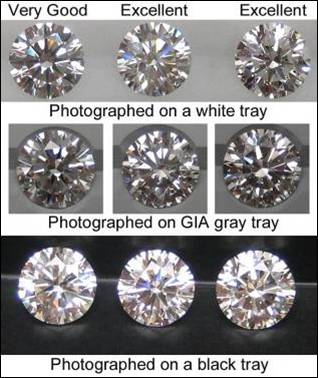
Figure 2. Specimens from Table 1 photographed in Diamond Dock on different backgrounds (trays) Note that the GIA gray tray provides the best appearance for the deeper stone (C). The black background is the worst for this stone as most of the table area is dark. |
||
Ideal-Scope and AGS ASET scope results
Fig 3. shows Ideal-scope (top) and AGS ASET images for the same three diamonds from Table 1: shallow, ideal and deep.
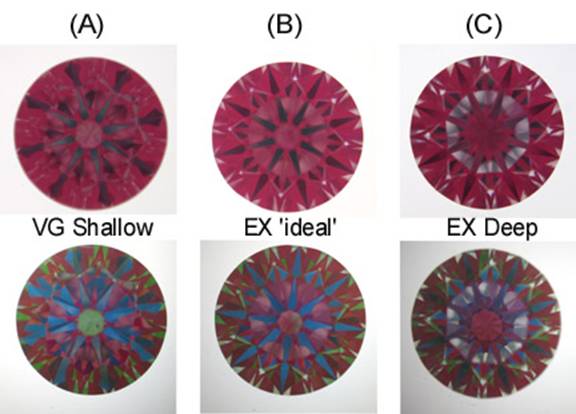
Figure 3. Ideal-scope (top) and AGS ASET (bottom) images of the diamonds from Table 1
The shallow VG stone (A) shows too many dark zones in the ideal-scope and too much blue through ASET. The ‘ideal’ stone (B) has excellent Ideal-scope and ASET images, deserving of its Excellent cut grade. The deep GIA Excellent stone (C) has a lot of leakage just inside the table, and the dark or blue star pattern is weak in Ideal-scope and ASET images respectively. This stone has a very good DiamCalc contrast score (1.01), but because the stone is large enough for the leakage zone (contributing to the stones contrast score) to be visually seen as a circular dark zone, I believe the contrast result is misleading.
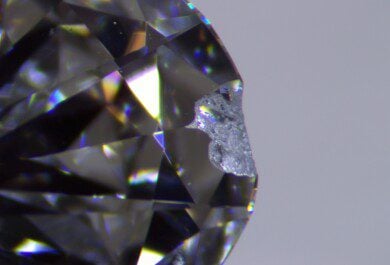
Figure 4 shows close ups of the GIA deep “Excellent Cut” (stone C from Table 1). Fig. 4.1, on a white tray*, shows light colored regions inside the table. Fig. 4.2, is the most attractive with better contrast; the stone is resting on the GIA’s gray tray. Fig. 3.3 shows table leakage when the background is black.Figs. 4.4 & 4.5 (ideal-scope and AGS ASET) shows leakage areas are light to white and indicate that little or none of the light from sources above the diamond can be returned to a face up observer. The DiamCalc light return for the table region only of stone (C) is 0.63 for a single eye and 0.74 for stereo vision.
Fig. 4.6 shows the stone resting on fingers; skin can be seen through the table region.
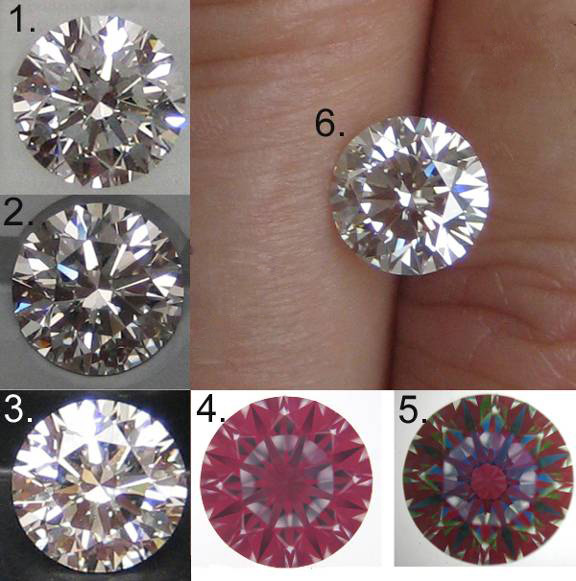
Figure 4. Close ups of the GIA deep “Excellent Cut” (stone C from Table 1): 1.- on a white tray; 2.- on GIA’s gray tray. 3.- on black background. 4. & 5.- Ideal-Scope and AGS ASET photos. 6.- on fingers
* – The white background appears gray because the camera was set (for all these photo’s) to make an average exposure. Our eyes work in a similar manner; a diamond on a dark background will always appear brighter than the same stone on a light background.
Figure 5 shows observers under 30 years of age (top and center) examining the three diamonds resting in their fingers. On the lower row an older observer is examining the stones. On the center right is a dome used by the GIA to replicate the Diamond Dock ‘brightness’ lighting.Younger observers preferred the ‘ideal’ (B) followed by the deep stone (C). Older observers preferred the shallow (A), followed by the ‘ideal’ stone (B). The dome in Figure 5 was used by the GIA and has a central peep hole and a dark area that mimics 46° obstruction of the available 180° of illumination.
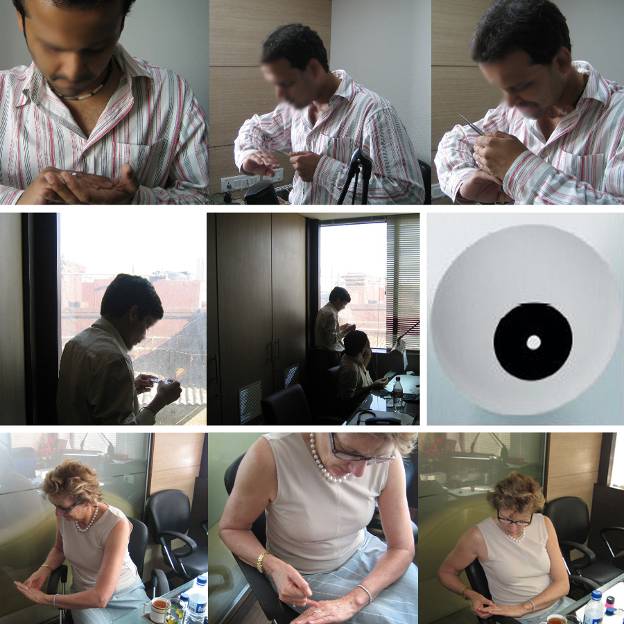
Figure 5. Observers of different ages (young, top and center and older, lower) examining the three diamonds resting in their fingers. On the center right is a dome used by the GIA to replicate the Diamond Dock ‘brightness’ lighting.
When various observers of different ages were shown the three stones and asked to rank them in size order, more than half thought the lightest shallow diamond (A) had the largest diameter; bigger even than the stone that weighs 12% more. This is probably because the light return at the edges is better as is evident in the photo on the dark background shown here again in Figure 6. OctoNus DiamCalc shows that although this stone has somewhat reduced light return from the table, the crown facet light return is very high.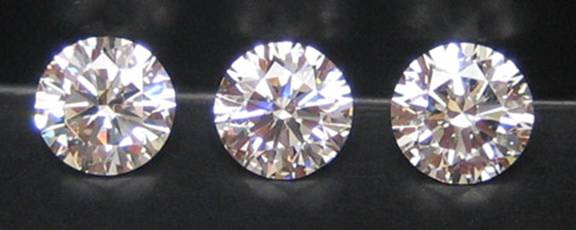
Figure 6. The shallow stone on the left would be the best value if size counts.
It is true that few experts like shallow proportioned diamonds, however as a diamond retailer I know that many consumers do.
When all three stones are dirty, with the usual grease etc, then the shallow ‘Very Good’ stone will look the best of the three.
The Lab Director of the American Gem Society diamond grading laboratory, Peter Yantzer, ran a Helium 3 Dimensional file through the AGS ASET grading software and concluded that the deep stone (C) rates as AGS 2 and (A) rates AGS 3 on a scale where 0 is best and 10 is worst.Stone (A) received a cut grade of AGS 3 with deductions of:
Stone (B) received 0 for light performance. It has an extra facet or natural on the pavilion that would lower the symmetry grade – probably to AGS 1.
Stone (C) received these deductions using the AGS software:
The left of Figure 7 shows a dealer using a typical fluorescent desk light with twin 15 watt fluorescent daylight tubes. The center photo shows stones being examined in a gray tray inside GIA’s Diamond Dock. The third group of photo’s on the right are taken with the camera inside Diamond Dock.
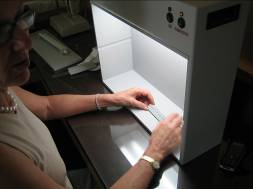

Figure 6 On the left is a typical dealer lighting*, in the center stones are being examined in a gray tray in GIA’s Diamond Dock. The third group of photographs clockwise from the top left – the camera is facing up from the position diamonds would be placed and the exposure is set on the lights – a 180° panorama taken into the room – and reflections seen in a spoon of a well lit diamond sorting room with a midday sun facing window.
The GIA Cut Study team appears to have replicated a diamond lighting environment used when buying and selling diamonds. Commercial diamond traders use a desk mounted twin fluorescent lamp, positioned so that light entering the pavilion makes inclusions easier to see when the diamond is held in tweezers and examined with a loupe; the more table leakage a diamond has in this lighting, the brighter the stone appears. Conversely many dealers do not like shallower diamonds; they appear relatively dark when backlit because they have less leakage because.
Lighting brightness is a squared function of distance; if GIA’s twin fluorescent light was mounted in an office or home ceiling, the brightness would be between 30 and 100 times dimmer (depending on the distance to the diamond) than the light in Diamond Dock, which is 33cm (13 inches) or less from the diamonds being graded. The overall brightness of the illuminated area inside the light box alters the way we perceive brightness and contrast.
Contrary to common belief, a diamond viewed in more intense light on a light colored background appears darker because our eyes physiological response is to reduce the size of our pupil. The same auto exposure function resulted in the white tray (top) in Figure 2 having a gray appearance in the photo. This means that differences between diamonds return is minimized compared to the difference we would see in normal lighting. This is also a partial explanation of why the difference between the three diamonds is more apparent on the black tray.
A second contributing factor is the leakage in stone (C) that illuminates part of the tray behind the stone. This illuminates the tray making the leakage area brighter than it would otherwise be in all but the black tray (Figure 4).
The group of photographs on the right side of Figure 7 shows the relative darkness of the rest of the room compared to the brightness of the area where diamonds are examined. This is best represented by looking at the reflections in the spoon which is resting in the position where diamonds are appraised for cut quality. An observer’s body would typically block some or all of the 5 direct light sources (ceiling fluorescent lights) and the window. This makes the Diamond Dock lights the predominant source of light as the rest of the surroundings are in relative darkness; an analogy is when you leave a darkened cinema or theatre during daytime. Our eyes adapt to the relative brightness of the Diamond Dock area and tray that is facing the strong lights at close proximity (compare Figure 1 taken with a flash, to the center photo in Figure 7).
Unless a diamond is cut with proportions that gather light from the direction of the lights in Diamond Dock, it would not be favored. If a seat was set at a fixed height, then short people would favor deeper diamonds; a Tolkowsky ‘ideal’ diamond would gather very little light from the light box as much of its potential illumination would come from the area of relative darkness outside the light box and behind the observer (see Figure 8). Very tall people however would favor shallow stones; these return more light from higher angles or from a more face up direction.
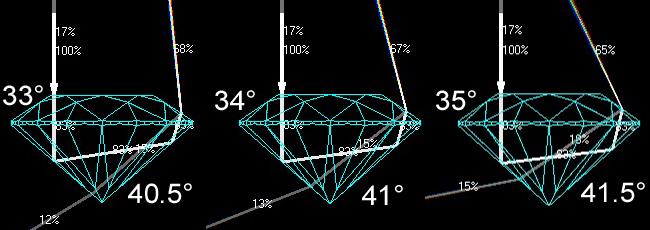
Figure 8 shows DiamCalc ray paths for progressively deeper diamonds: 40.5°, 41.0° and 41.5° pavilion angles and crown angles of 33°, 34° and 35° respectively. Note the angle of the light entering (or leaving) the crown facet.
The dome shown on the right center of Figure 5 has a central peep hole and a dark area that mimics 46° obstruction of the available 180° of illumination. This is equivalent to a viewers head (of say 15cm) obstructing illumination when viewing the diamond from a distance of 19cm (7.5inches). This is a much closer or larger field of obstruction than those chosen by other researchers**.
The Foundation article noted this regarding observation distance:
“To obtain stronger correlations with our diamond observation results, this time we also modeled a localized observer…… like a person who looks at a diamond from …a reasonably close distance, in this case about 14–20 inches—roughly 35–50 cm—as we noted in most trade observations.”
An obscuration of 46° requires a head of around 30cm (12 inches) or more blocking illumination from behind and above the observer.
* Photo taken from Gems & Gemology Foundation article.
** – AGS uses 30° obstruction predominantly, with 40° as an additional standard.
A number of photographs in Figure 9 of the same two Cubic Zirconia stones have been taken in various types of typical lighting. The photo on the gray tray (fourth from the top) is taken inside Diamond Dock.
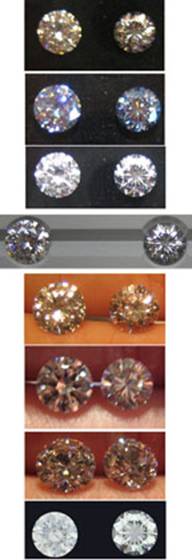
Figure 9. Several photographs of the same good (left) and bad (right) Cubic Zirconia stones (used for Ideal-scope demonstrations) were taken in various lightings. The photo on the gray tray is taken inside Diamond Dock
The stone on the left is a very well cut CZ used as a calibration stone with an Ideal-scope. The stone on the right is an extremely steep / deep stone that is used to demonstrate how poor a bad cut can be. When viewed in the Diamond Dock the relative difference between these two stones was minimal. There was perhaps the least difference between the beauty of the CZ’s that I have witnessed; I always carry these two stones with me in a small viewing box as a tool for analysis of the effects of various types of lighting.
GIA found that their observations matched only 58% of their computer ‘metrics’ for WLR (brilliance – then brightness) and DCLR fire research. In the Foundation article there is an admission that scintillation and contrast were the reason for the 42% error factor.
In 1998 in the Brilliance article it was stated the study of cut would require metrics for brilliance, fire and scintillation. In the Foundation article GIA states:
“we did not believe that developing a specific “scintillation metric” was the right approach. (Recall that most of the sparkle aspect of scintillation was already being captured in our metrics for brightness and fire;”
This is a circular argument.
Using our Steep Deep stone (C) as an example, by estimation approximations from the charts in the two Brilliance and Fire articles, this diamond receives only 0.277 WLR (low ‘typical’) and 3.0 DCLR (low ‘average’) ‘brilliance’ and ‘fire’ metrics. Deeper pavilion diamonds (with thinner pavilions) with even lower WLR and DCLR scores are predicted
Therefore it is probably not a coincidence that there are no WLR or DCLR data listed in the Foundation article for the 45 mater stones.
It would appear that GIA have replicated dealers lighting, at very close proximity, which favours diamonds with steeper crown angles and deeper pavilions. The use of a gray tray further contributes to deeper stone preferences. It appears that computer metrics for brightness and fire have little or no role to play, and GIA have no metric or measure for scintillation.
Additional References
http://www.diamondcut.gia.edu/06_estimating_a_cut_grade.html
by Garry Holloway
HCA and Ideal-scope developer
www.ideal-scope.com – www.hollowaydiamonds.com.au
![]()

Retail Diamond Prices Chart Updated Monthly.
Picking out a men’s wedding band can feel like a big deal, right? There are so many choices out there, it’s easy to get a little lost. But don’t worry,…
Ever had that sinking feeling when you look at your beautiful diamond and notice a tiny chip? It’s a real bummer, especially since diamonds are supposed to be super tough.…

PriceScope presents the third edition of our monthly Lab-Grown Diamond Price Analysis, offering timely insights into this fast-moving segment of the diamond market. Since introducing lab-grown diamonds to our platform…
 is an easy tool that analyzes the data of round diamonds and calculates a score that grades cut quality.")