
Shop Diamond Jewelry Gifts for Mother’s Day
Why should you get your Mom diamond jewelry for Mother’s Day? Diamonds are appreciated for their clarity and brilliance. In much the same way, great mothers offer their children clarity…
Garry Holloway1 was the first to suggest a meaningful explanation for this: he suggested that, because there is a small difference between pavilion main & half facet slopes (less than 2º in a typical round brilliant), this may cause one to be dark when the other is bright – producing contrast in the gem’s image. Studies of human optical response2 say that this is attractive to viewers; it may be why the people Tolkowsky polled chose the proportions they did.
Fig.1 shows this effect in the ‘arrows’ of a Tolkowsky diamond with 80%-deep ’halves.’ With white light from everywhere above the gem and viewer, the dark areas result from the head obstructing light from sources that would be reflected by the mains to the viewer’s eye, but not by the ‘halves.’ As the stone, light source, or viewer moves, this contrast reverses, producing dynamic ‘scintillation,’ which is also attractive to the viewer2.
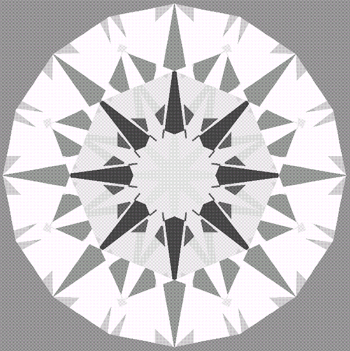
Fig.1 Simulation of Tolkowsky proportions with 80%-deep halves, using Vasiliev/s software3 at 15º angle of light obstruction by viewer’s head
Fig.2 shows the diamond chart of ‘Faceting Limits’ reversed to match MSU and GIA plots (pavilion vertical) and limited to show only the region of primary interest.
Additionally, it has added the head-obstruction zones for reflection by 75% halves on a Tolkowsky diamond. As pointed-out by Yuri Shelementiev of MSU, in today’s cuts the halves dominate and become a greater factor in reflecting light than the mains.
Note that the Tolkowsky cut is not at the ‘edge’ of reflection by the halves when viewed square to the face; the gem must be tipped or the head or light source moved to see this obstruction.
Fig.3 shows how this compares with the ‘best’ findings of MSU and GIA = remarkable correlation of three different approaches.
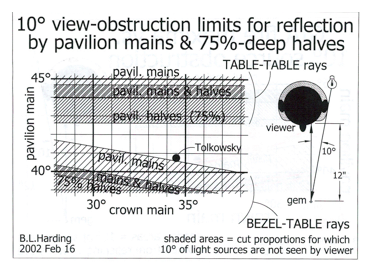
Fig.2: ‘Faceting Limits’ chart reoriented and half limits added
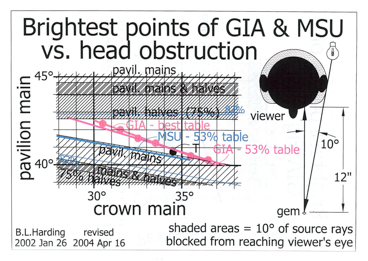
Fig.3: color lines = ‘brightest’ per GIA & MSU
by Bruce L Harding, circa 2004, 2008 Aug 11
References
1. Diamond dealer, Melbourne, Australia
2. “Seeing the Light,” Falk et al, Chapter 7.1-4, John Wiley & Sons, 1986
3. “Facet Design,” Anton Vasiliev, circa 2002

Retail Diamond Prices Chart Updated Monthly.
Why should you get your Mom diamond jewelry for Mother’s Day? Diamonds are appreciated for their clarity and brilliance. In much the same way, great mothers offer their children clarity…
If you are looking to pop the question this spring, we have you covered for engagement ring shopping. We’ll add some proposal ideas too to inspire you when you take…
We don’t talk about birthstones every single month, but we love any opportunity to talk about our favorite gemstones. Diamonds are among our favorite gemstones. The diamond is the birthstone…
 is an easy tool that analyzes the data of round diamonds and calculates a score that grades cut quality.")